Insert a Chart Sheet in Excel Easily

In today's digital world, Microsoft Excel stands as a pinnacle of efficiency for data management and analysis. Whether you're a seasoned professional or a newcomer to data manipulation, Excel's versatility ensures that you can manage, analyze, and present data effectively. Among its many features, the ability to insert a chart sheet provides a clear and engaging visual representation of data, making complex numbers understandable at a glance. In this post, we'll guide you through the simple steps to insert a chart sheet in Excel, ensuring you can showcase your data in the most accessible format.
Why Use Chart Sheets?

- Data Visualization: Convert raw data into graphs or charts for a quick grasp of trends and patterns.
- Presentation: Separate charts from your dataset, enhancing the clarity of your presentations.
- Efficiency: Organize charts in a dedicated space, simplifying navigation for both you and your audience.
Step-by-Step Guide to Insert a Chart Sheet in Excel

Let’s dive into the step-by-step process to insert a chart sheet in Excel:
1. Select Your Data

Before you create any chart, you need to ensure you’ve selected the right data. Here’s how:
- Click and drag your mouse to highlight the range of cells containing the data you want to include in your chart.
🔍 Note: Ensure your selected data includes headers and labels for proper chart representation.
2. Insert Your Chart

After selecting your data, follow these steps to insert a chart:
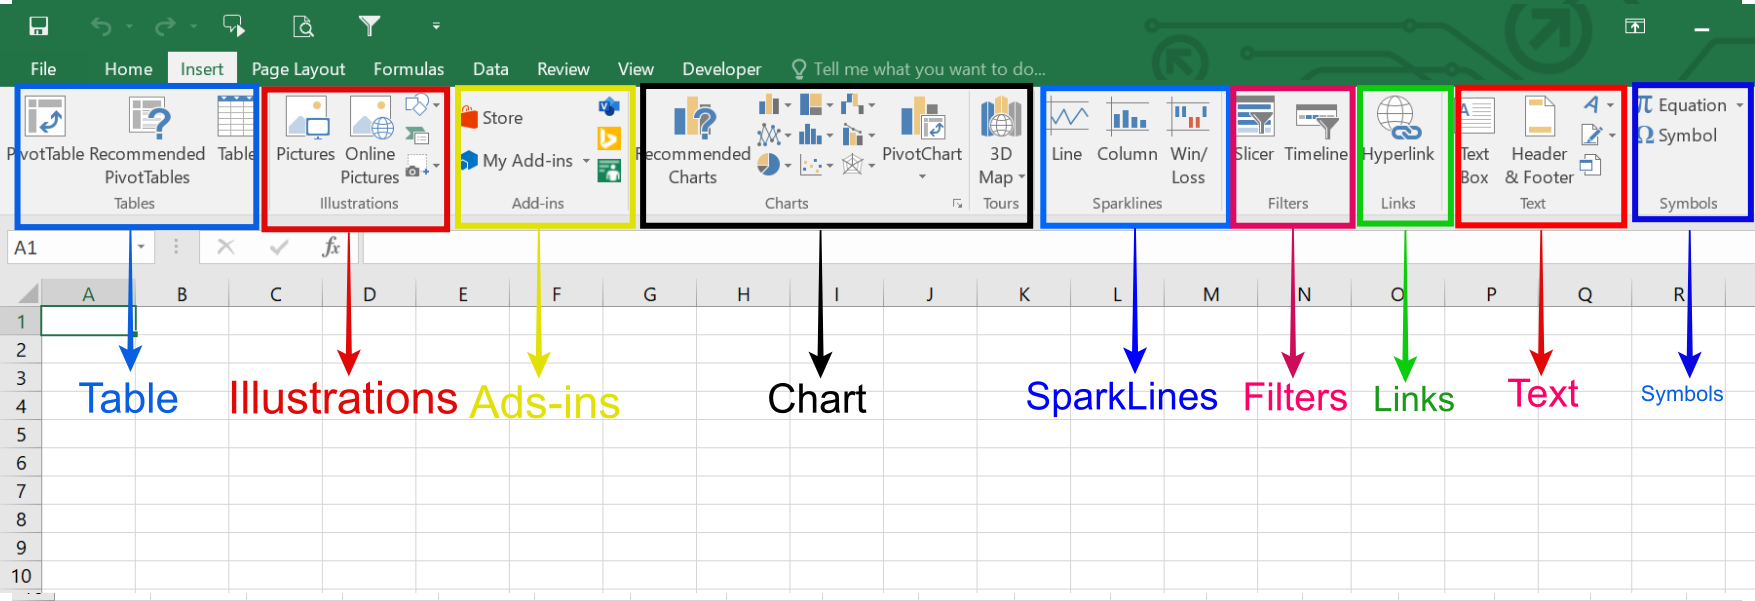
- Go to the ‘Insert’ tab on the Ribbon.
- Choose from a variety of chart types under the Charts group, like Column, Line, Pie, etc.
- Once you’ve decided on the chart type, click on the chart icon to add it to your worksheet.
3. Create a Chart Sheet

Now, let’s transform the chart into a separate chart sheet:
- Right-click on the chart.
- From the context menu, select ‘Move Chart’.
- In the dialog box that appears, choose ‘New sheet’.
- Provide a name for your chart sheet or use the default name.
- Click ‘OK’ to complete the process.
| Step | Action |
|---|---|
| 1 | Select Data |
| 2 | Insert Chart |
| 3 | Create Chart Sheet |

💡 Note: Chart sheets are dynamic; if you change the original data, the chart in the chart sheet updates automatically.
Formatting Your Chart

Once you’ve inserted the chart sheet, you can enhance its appearance:
- Use the ‘Chart Tools’ that appear when you click on the chart to access the Design, Layout, and Format tabs.
- Adjust chart elements like title, axis labels, legend, etc., to match your presentation needs.
- Try different chart styles, colors, and layout options to find the best visual representation.
Sharing and Collaborating with Chart Sheets

Excel’s chart sheets are not just for internal use. Here are ways to share them:
- Export: Export your chart sheet as an image or PDF to include in reports, presentations, or share via email.
- Collaborate: If you’re using Excel online or a shared workbook, team members can interact with the chart sheet in real-time.
🗣️ Note: Remember to ensure that others have the necessary access rights if you're sharing via cloud platforms.
Conclusion

Incorporating a chart sheet into your Excel workbooks can significantly enhance your ability to present data effectively. With this detailed walkthrough, inserting a chart sheet in Excel becomes a straightforward task. By following these steps, you can not only streamline your data visualization but also make your presentations more impactful and understandable. Whether you’re working on financial reports, analyzing sales data, or preparing for a presentation, the ability to quickly create and customize chart sheets will prove invaluable, making your Excel experience more productive and visually engaging.
Can I insert multiple charts into one chart sheet?

+
No, Excel allows only one chart per chart sheet, but you can easily insert multiple chart sheets or add additional charts to your workbook for comparison.
Is it possible to link chart sheets to external data?

+
Yes, chart sheets in Excel can be linked to external data sources like Access databases, SQL Server, or even cloud-based services, allowing for dynamic updates.
How do I update data in an existing chart sheet?

+
If your chart is dynamically linked to data within the workbook, updating the data source automatically refreshes the chart. For external links, you may need to manually refresh the chart.