5 Simple Steps to Graph Excel Data Effectively

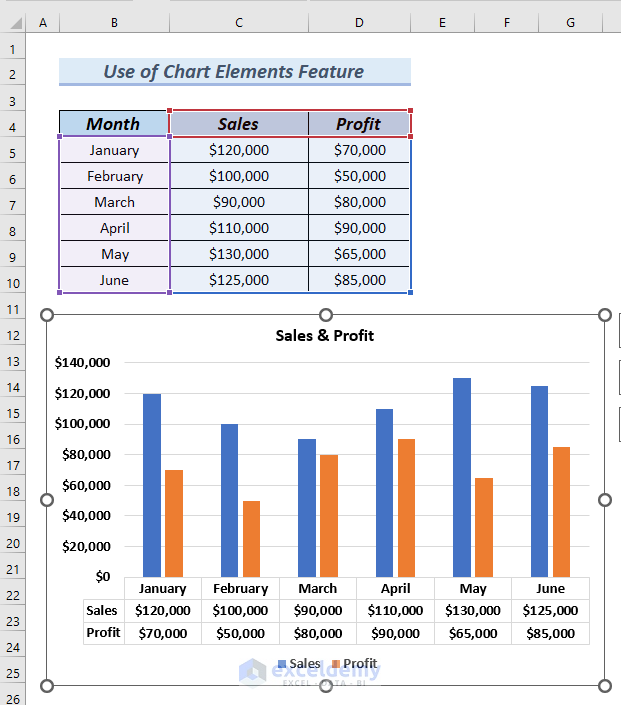
Mastering the art of graphing Excel data not only enhances the visual appeal of your reports but also significantly improves the clarity of data communication. Here’s a concise guide on how to graph Excel data effectively in just five simple steps.
Step 1: Prepare Your Data

The first step in creating effective graphs in Excel is to organize and clean your data:
- Check for Errors: Ensure there are no errors or missing values that could skew your graph.
- Data Range: Highlight the range of data you want to graph. Including headers can provide useful labels.
- Sort and Filter: Sort your data for better readability or filter out unnecessary information.
Step 2: Select the Right Chart Type

Excel offers various chart types, each suited for different data representation:
- Column and Bar Charts: Use for comparing categories of data over time or between different groups.
- Line Charts: Ideal for showing trends over continuous data like dates or time.
- Pie Charts: Show the proportion of categories within a whole. Best when there are few categories.
- Scatter Plots: Suitable for showing relationships between two variables.
📊 Note: When in doubt, use a column chart for most purposes due to its versatility.
Step 3: Insert the Graph

With your data prepared and chart type decided, insert your graph:
- Click the 'Insert' tab on the ribbon.
- Choose your chart type and select the appropriate subtype.
- Excel will automatically generate a preview. If satisfied, click to insert the graph.
| Chart Type | When to Use |
|---|---|
| Column Chart | Comparisons among categories |
| Line Chart | Time series data |
| Pie Chart | Showing parts of a whole |

Step 4: Customize Your Graph

Customizing your graph will make your data stand out:
- Change Colors: Adjust the color scheme to enhance visibility or match your theme.
- Add Labels: Include axis titles, data labels, and a legend if needed.
- Modify Layout: Change the layout of elements like chart title, axes, and gridlines for better presentation.
Step 5: Analyze and Interpret

Once your graph is prepared, take the time to analyze:
- Examine trends or outliers. Use trendlines for predictions.
- Compare different data sets within the same graph.
- Consider adding annotations for important data points.
After following these steps, you'll have a graph that not only looks professional but also conveys your data's story effectively. By organizing your data, choosing the right chart type, inserting and customizing the graph, and finally analyzing the results, you've created an informative visual representation of your data.
💡 Note: Remember, graphs should simplify the understanding of your data, not complicate it.
Therefore, with this approach, your Excel graphs will not only be easy to read but also insightful, helping stakeholders make informed decisions based on clear, visual data presentation.
What type of chart is best for time-based data?

+
Line charts are most effective for displaying data that varies over time because they clearly illustrate trends.
How do I ensure my graph is not misleading?

+
To avoid misleading graphs, start axes at zero, use the same scale for similar data, and avoid 3D effects or extreme data compression.
Can I change a graph type after inserting it?

+
Yes, you can change the chart type by right-clicking on the graph, selecting ‘Change Chart Type,’ and choosing another chart.
What should I do if my data has too many categories for a pie chart?

+
For datasets with numerous categories, consider using a bar chart or a stacked bar chart instead, which can handle more data points without losing clarity.
Is it necessary to include a legend on every graph?

+
Legends are not always necessary, especially if you label each data series directly on the graph for immediate clarity.