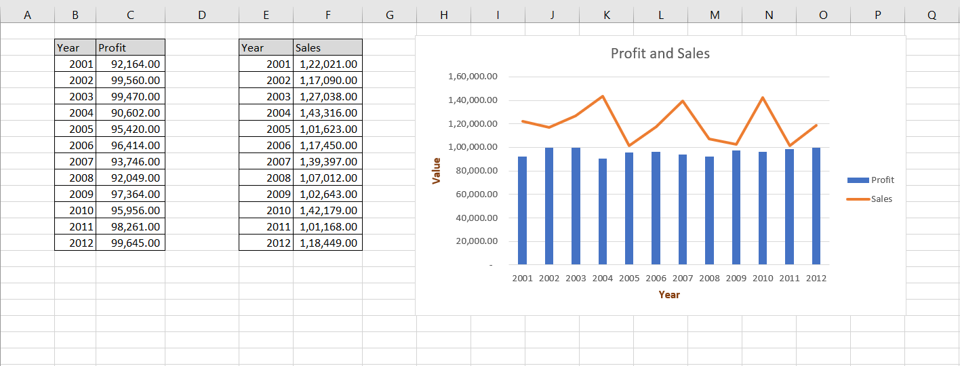
5 Ways to Graph Data from Multiple Excel Sheets Easily

Handling data from multiple Excel sheets can seem daunting, especially when you want to visualize the information effectively. Whether you're comparing sales figures, tracking project progress, or analyzing survey results, merging and graphing data from different sources requires a streamlined approach. In this guide, we'll explore five efficient ways to graph data from multiple Excel sheets, ensuring that you can make informed decisions with ease.
Method 1: Consolidate Data into One Sheet

The most straightforward method involves consolidating all relevant data into one Excel sheet:
- Open your Excel workbook with multiple sheets.
- Create a new sheet, which will serve as your ‘Master Sheet’.
- Use the Consolidate feature under the Data tab to bring all data together:
- Select where you want the consolidated data to start.
- Go to Data > Consolidate.
- Choose the function you want to use (Sum, Average, etc.).
- Select the range from each sheet you wish to include.
- Once consolidated, you can now create your graphs using the data in the master sheet.
👉 Note: Ensure that headers are consistent across all sheets to avoid data mismatch.
Method 2: Use Power Query

Power Query offers a powerful and flexible way to merge and clean data:
- Select the sheet where you want your graph.
- Go to Data > Get Data > From Other Sources > Blank Query.
- In the Power Query Editor:
- Connect to your workbook using From Workbook.
- Select the tables (sheets) you need to merge.
- Combine or append these queries as needed.
- Load the final query back into Excel.
Method 3: Dynamic Data Import

If you need data to update in real-time:
- Set up named ranges in each sheet you want to graph.
- In your main sheet, create a dynamic formula that references these ranges:
- Use INDIRECT to reference the named ranges.
- Create charts that update automatically as data changes.
- Link these ranges in your charts for a live data feed.
Method 4: External Data Connections

For more complex scenarios, connect to external data sources:
- Go to Data > Get Data > From Other Sources.
- Select from various options like From Access, From SQL Server, etc.
- Set up your connection, select the data you need, and load or link it into Excel.
- Create your graph from this data, which can update dynamically from external sources.
Method 5: Use Excel Macros and VBA

If you’re comfortable with programming, VBA can automate repetitive tasks:
- Open the Visual Basic Editor via Developer > Visual Basic.
- Create a new module or modify an existing one:
Sub GraphMultipleSheets()
    Dim ws As Worksheet
    Dim rngData As Range, rngChart As Range
    Dim cht As Chart

For Each ws In ThisWorkbook.Worksheets
    If ws.Name <> "Summary" Then
        Set rngData = ws.UsedRange
        Set rngChart = ThisWorkbook.Worksheets("Summary").Range("A1")
        Set cht = ThisWorkbook.Worksheets("Summary").Shapes.AddChart2(201, xlLine).Chart
        With cht
            .SetSourceData Source:=rngData
            .Location Where:=xlLocationAsObject, Name:="Summary"
        End With
    End If
Next ws


End Sub
After using any of these methods, key points to consider:
- Data Consistency: Ensure that data across sheets is formatted similarly and uses the same labels.
- Automation: Where possible, use automation to keep charts up-to-date without manual intervention.
- Visualization: Choose the right graph type to accurately represent your data.
Can I use these methods to graph data from different workbooks?

+
Yes, you can adapt these methods for data from different workbooks. For methods like Power Query, you’ll establish connections to each workbook separately before merging.
How do I keep my charts updated when the source data changes?

+
Use Dynamic Data Import or External Data Connections to ensure your charts automatically update as source data changes. This makes your visualizations current without manual updates.
What if my data sheets have different structures?

+
To graph effectively, ensure your data is consistent. Use Power Query to transform or clean the data before merging or graph different aspects of the data separately if structures differ significantly.


