5 Easy Ways to Calculate Customer Percentage in Excel

Managing customer data efficiently can significantly enhance business strategies, and Microsoft Excel provides a robust platform for these calculations. In this post, we'll explore 5 easy ways to calculate customer percentages in Excel that can help you make informed decisions based on your customer base's behavior and preferences.
Using the Standard Formula

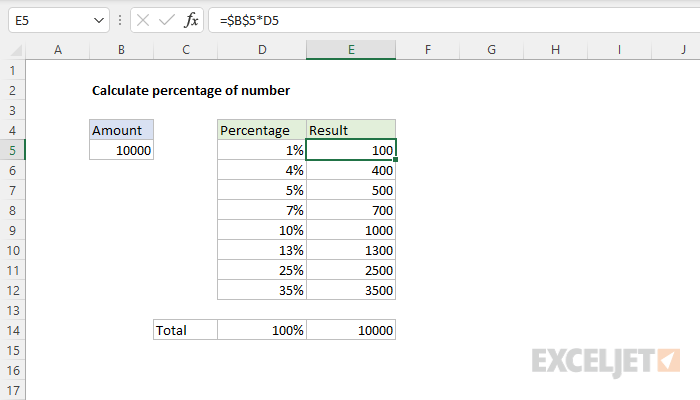
Excel’s simplest method to calculate a customer percentage involves a basic formula:
- Select the cell where you want the result.
- Enter the formula:
=A1/B1, whereA1is the number of customers who meet your criteria, andB1is the total number of customers. - Format the cell as a percentage to display the result in percentage terms.
This formula divides the number of customers by the total number, giving you a percentage directly.
📌 Note: Ensure both cells contain numeric values, otherwise, you’ll get an error or unexpected result.
Conditional Formatting for Quick Analysis

Conditional Formatting can visually highlight cells based on criteria, which is particularly useful when tracking customer percentages:
- Select the data range you want to analyze.
- Go to the ‘Home’ tab, click ‘Conditional Formatting’, then choose ‘New Rule’.
- Select ‘Use a formula to determine which cells to format’.
- Enter a formula like
=(A1/B1)*100 > 10to highlight customers where their percentage is greater than 10%. - Choose a format (like color fill) for these cells to make them stand out.
By using conditional formatting, you can quickly spot trends or anomalies in your customer data.
Utilizing Data Bars for Visual Representation

If you’re interested in a quick visual comparison of customer percentages:
- Select your data range.
- Go to ‘Home’, then ‘Conditional Formatting’, and select ‘Data Bars’.
- Choose a color for the data bars.
Data bars give you an immediate sense of each customer’s percentage relative to others, making it easier to analyze your customer base at a glance.
The PIVOTTABLE for Detailed Analysis

When dealing with large datasets, PIVOTTABLEs can provide a dynamic way to calculate customer percentages:
- Select your data range.
- Go to ‘Insert’, then select ‘PivotTable’. Choose where you want the PivotTable to be placed.
- Drag your criteria field to the ‘Row Labels’ area, and your numeric field to the ‘Values’ area. Here, set the value field to show ‘Percent of’.
| Customer Category | Percentage |
|---|---|
| Regular | 30% |
| VIP | 20% |
| New | 50% |

This approach gives you the flexibility to slice and dice your data in various ways to find valuable insights.
📌 Note: Ensure your data source has clear headers to make PIVOTTABLE setup straightforward.
Excel Formulas for Advanced Calculations

For more complex scenarios or when you need to combine several calculations:
- Use the
COUNTIForCOUNTIFSfunctions to count customers meeting specific criteria. - Combine this with
SUMfor total customers to calculate the percentage. Example:=COUNTIF(range, criteria)/SUM(range). - Utilize array formulas for more advanced calculations, which can be entered by pressing Ctrl + Shift + Enter.
These formulas provide a tailored approach to calculating customer percentages, making your Excel sheet a powerful analysis tool.
Mastering Excel functions for customer percentage calculations equips you with the tools to unlock insights from your customer data. Whether you're tracking customer loyalty, identifying high-value segments, or analyzing market trends, Excel provides a versatile platform for data-driven decision-making. Keep your data clean and well-organized, and make the most of Excel's visual tools to not just calculate, but to also interpret and communicate your findings effectively. Here's to making smarter business decisions with the power of Excel!
Can Excel calculate dynamic percentages based on changing criteria?

+
Yes, by using dynamic arrays and Excel formulas like COUNTIFS with dynamic criteria, Excel can automatically update percentage calculations as your data changes.
How do I ensure my percentage calculations are accurate in Excel?

+
Ensure your data is clean, free from errors or inconsistencies. Use validation to prevent incorrect data entry, and double-check your formulas for accuracy.
What if my customer data changes frequently?

+
Use dynamic references in your formulas or leverage Excel’s PIVOTTABLE feature for real-time updates. You can also set up alerts or use Excel’s change tracking features to monitor data changes.
Can I automate percentage calculations in Excel?

+
Yes, through VBA scripting or by using Excel’s built-in tools like conditional formatting and data validation rules that can dynamically adjust percentage calculations as your data changes.