Master Excel Sheet Creation in Simple Steps

Mastering Excel sheet creation can significantly boost productivity, streamline data organization, and facilitate better decision-making. Whether you're an office worker, a student, or managing your personal finances, Excel remains an indispensable tool. Here's your guide to creating, managing, and optimizing Excel sheets with ease.
Understanding Excel Basics

Before we dive into the specifics of creating spreadsheets, let’s revisit the foundation:
- Cells: The intersection of columns (labeled A, B, C…) and rows (1, 2, 3…).
- Worksheets: Individual sheets within a workbook, often referred to as tabs.
- Formulas: Mathematical expressions used for calculations.
- Functions: Predefined formulas in Excel for common calculations.
💡 Note: Excel supports a vast array of functions for different purposes, from simple addition to complex data analysis.
Creating a New Excel Sheet

To start, let’s create a new Excel sheet:
- Open Microsoft Excel.
- Click on “File” or the “+” button to start a new blank workbook.
- If you want to use a template, choose one from the options available.
Basic Excel Sheet Setup

Once your sheet is created, here are steps to set up the basics:
- Rename the workbook and sheets:
- Right-click on the sheet name at the bottom and select “Rename.”
- Type in a name that reflects the sheet’s content, like “Project Budget” or “Inventory List.”
- Set up your table:
- Fill in headers for columns, making sure they describe the data accurately.
- Align headers for better readability by selecting the cells and using the alignment options under the “Home” tab.
- Apply formatting:
- Use bold, italics, or
underlinedtext for emphasis. - Set up cell styles like currency, dates, or percentages for data consistency.
- Use bold, italics, or
Inserting Data into Excel

Entering data is the next step:
- Click on the cell where you want to input data and start typing. Use the Enter key to move to the next row or Tab to move to the next column.
- Use AutoFill for sequential data (dates, numbers, etc.) by dragging the fill handle (a small square in the lower-right corner of the active cell).
💡 Note: Use Excel’s “Flash Fill” to quickly fill in data based on patterns detected in adjacent columns.
Using Formulas and Functions

Excel’s true power comes from its ability to automate calculations:
- Simple formulas:
- Start with an “=” for calculations, like “=A1+A2” to add cell contents.
- Common functions:
- SUM: Adds up all numbers in a range, e.g., “=SUM(A1:A10)”
- AVERAGE: Calculates the mean of a range, e.g., “=AVERAGE(B2:B20)”
- IF: Conditional function, e.g., “=IF(A1>10,“Yes”,“No”)”
To use functions:
- Click where you want the result to appear.
- Type “=” followed by the function name or use the Formula Bar’s “fx” button to insert functions.
- Select or type the range or individual cells for the function to apply to.
- Press Enter to complete the calculation.
Organizing and Analyzing Data

To manage large datasets efficiently:
- Sorting: Use Data > Sort & Filter > Sort to organize data by one or more columns.
- Filtering: Data > Sort & Filter > Filter to show only relevant data.
- Tables: Convert your range to a table for automatic formatting and easy filtering:
Header 1 Header 2 Header 3 Data 1 Data 2 Data 3 
Advanced Excel Features

For those ready to take their Excel skills to the next level:
- PivotTables: Insert > Tables > PivotTable for summarization and analysis of data.
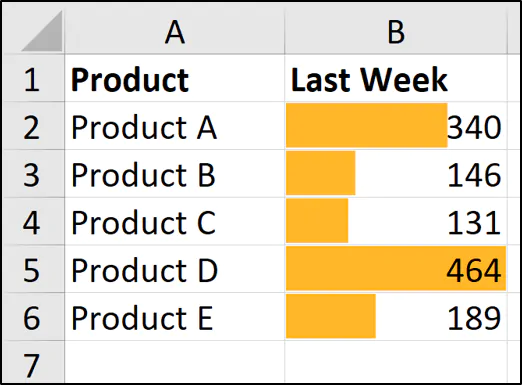
- Conditional Formatting: Highlight cells or ranges based on specific criteria.
- Macros: Automate repetitive tasks with VBA scripting.
Throughout your journey with Excel, you'll find that mastering these basic to advanced functionalities not only helps in creating and organizing data but also in analyzing and presenting it effectively. Whether you're working on a project budget, tracking inventory, or analyzing survey results, Excel's versatility ensures you're always in control.
What are some essential tips for beginners in Excel?

+
Start by understanding the Excel interface. Learn how to navigate cells, rows, and columns, basic formulas like SUM, AVERAGE, and how to format cells for different data types. Remember to use keyboard shortcuts for efficiency.
How can I make my Excel sheet more visually appealing?

+
Use themes and cell styles under the "Home" tab, apply conditional formatting for data visualization, insert images or charts to break up text, and ensure data is organized into a clear table format with appropriate header styles.
What are the most useful Excel functions for data analysis?

+
Here are a few key functions for data analysis:
- SUMIF or SUMIFS: Sum values based on criteria.
- VLOOKUP/HLOOKUP or INDEX/MATCH: Look up values in a table.
- COUNTIF/COUNTIFS: Count cells that meet specific criteria.
- IFERROR: Handle errors gracefully in formulas.
- AVERAGEIF/AVERAGEIFS: Average cells based on criteria.
In summary, becoming proficient with Excel sheets is about mastering the basics, understanding how to input and format data, and effectively using formulas and functions to manipulate and analyze data. Remember that practice is key to improving your skills, and the features mentioned here are just the beginning. As you delve deeper, explore Excel’s extensive function library, utilize advanced tools like PivotTables, and consider automating tasks with macros to truly harness the power of Excel in your daily or professional tasks.