5 Ways to Find Top Excel Item Easily

Mastering Excel: Efficient Methods to Find Top Items

In today's business environment, Microsoft Excel stands as a cornerstone tool for data analysis. The ability to quickly and accurately find the top items in your data set can significantly boost efficiency and decision-making processes. This comprehensive guide will walk you through five effective strategies to pinpoint the top items in Excel with ease.
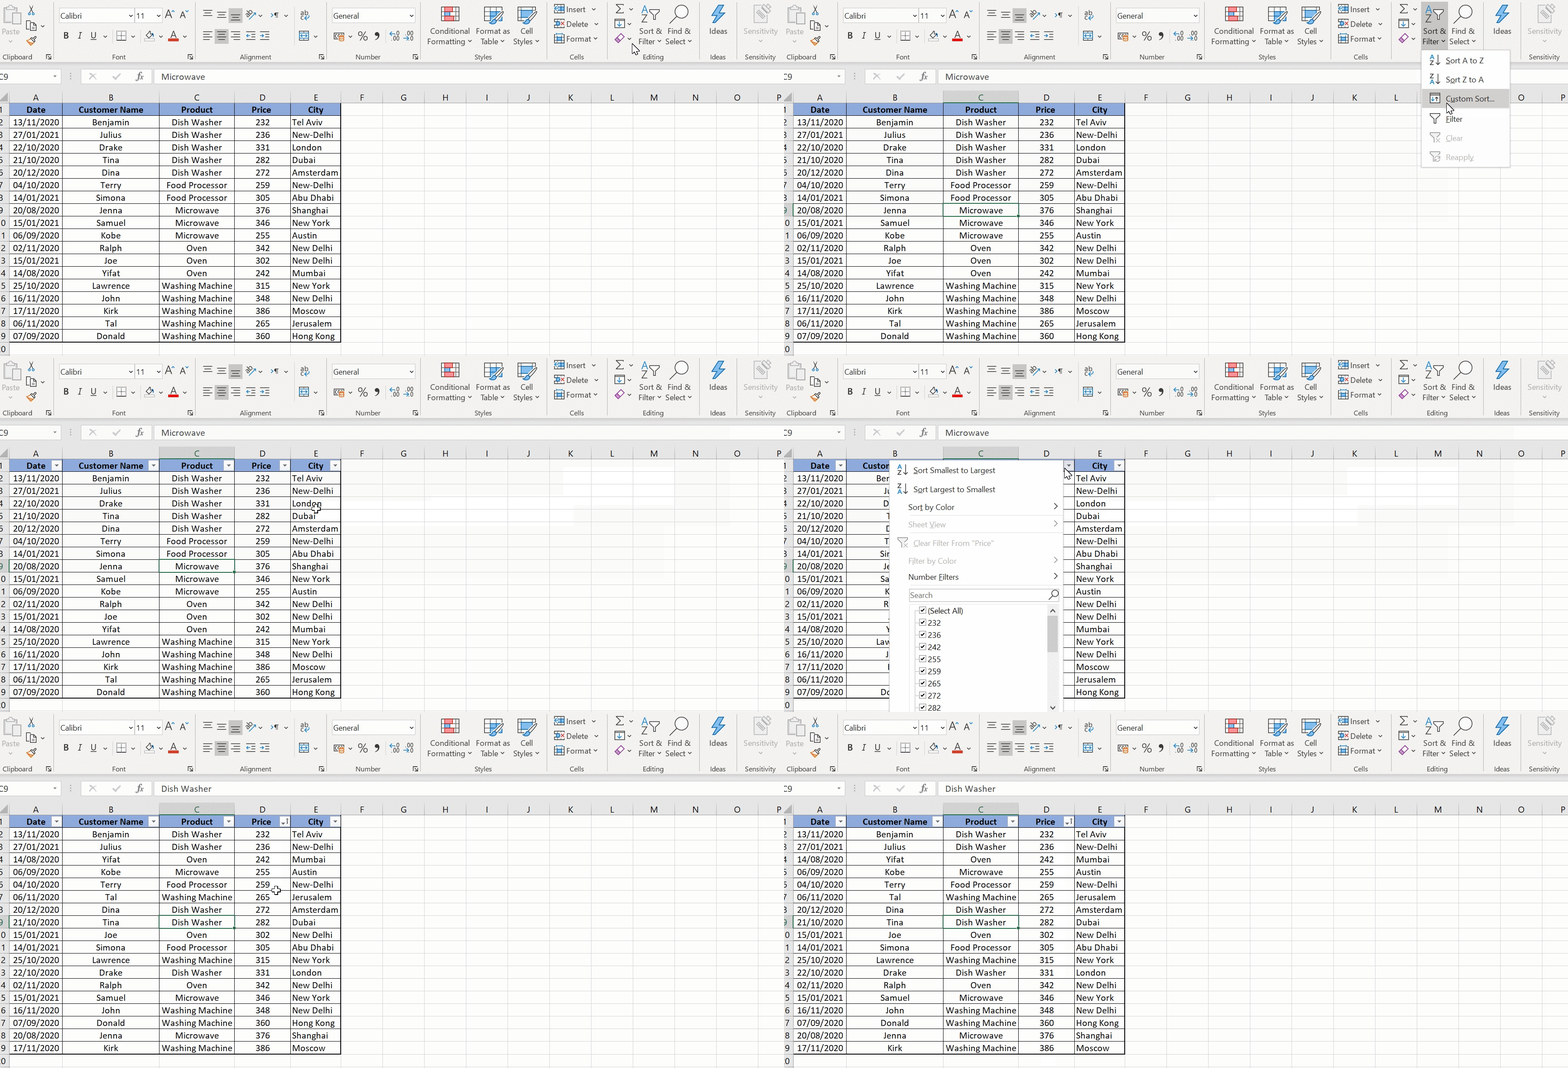
Method 1: Using the SORT Feature

Excel's SORT feature is perhaps the most straightforward method for identifying top items. Here's how you can use it:
- Select the column or range containing the data you wish to analyze.
- Go to the "Data" tab on the Ribbon and click on "Sort A to Z" or "Sort Z to A".
- If you're dealing with numerical data, sorting in descending order will bring the top items to the top.
⚡️ Note: Sorting doesn't just reorder the selected column, it rearranges the entire row based on the selected column.
Method 2: Leveraging Conditional Formatting

Conditional formatting provides a visual cue to spot your top items:
- Select your range of cells.
- Click on "Home" > "Conditional Formatting" > "Top/Bottom Rules" > "Top 10 Items".
- Adjust the number if necessary, and choose a highlight color for easy identification.
🎨 Note: Visual cues help you spot outliers or exceptional values quickly, but they're not interactive for further analysis.
Method 3: FILTER Function

The FILTER function, introduced in Office 365 Excel, allows for dynamic data filtering:
- Apply the FILTER formula like this: FILTER(data, condition) where "data" is your data range and "condition" defines which items are considered "top" (e.g., sales amount greater than average).
- The result will dynamically update if the underlying data changes, offering real-time insights.
💡 Note: The FILTER function requires modern Excel versions. For older versions, consider using pivot tables or data filters.
Method 4: Excel Tables with Slicers

Excel Tables with Slicers provide an interactive way to analyze your data:
- Convert your data to an Excel Table by selecting the range and going to "Insert" > "Table".
- Insert Slicers by selecting "Table Tools Design" > "Insert Slicer".
- Use these Slicers to filter and isolate the top items dynamically.
👉 Note: Slicers are particularly useful for dashboards and summary reports where interaction enhances user experience.
Method 5: The LARGE Function

The LARGE function is perfect for scenarios where you need specific top values:
- Use the formula: =LARGE(data, 1) to retrieve the largest value in the dataset, then change the second argument (e.g., 2, 3, 4) to see the 2nd, 3rd, or 4th largest values.
- Combine this with other functions like INDEX and MATCH for more complex top item analysis.
Each of these methods offers unique advantages depending on your data's nature and the analysis you aim to perform. Sorting provides a quick overview, conditional formatting offers visual cues, while dynamic functions like FILTER allow for real-time updates. Tables with slicers are ideal for interactive reporting, and the LARGE function suits specific value extraction.
By mastering these techniques, you can improve your efficiency in working with Excel, ensuring that critical decisions are data-driven and based on the most up-to-date insights from your datasets. Remember, while Excel offers many tools for data analysis, the right choice depends on your specific data needs and the insights you seek to extract.
What is the difference between sorting and conditional formatting?

+
Sorting in Excel rearranges your data based on specific criteria, while conditional formatting visually distinguishes data by applying colors or styles based on given conditions.
Can I combine these methods for better results?

+
Yes, integrating methods like sorting, conditional formatting, and dynamic functions can offer comprehensive insights, enhancing your ability to analyze and present data.
Is the FILTER function available in all Excel versions?

+
No, the FILTER function is exclusive to Office 365 subscribers, requiring a recent version of Excel.
How do I handle dynamically changing data for my analysis?

+
Use Excel Tables, the FILTER function, or set up dynamic named ranges to ensure your formulas update automatically when the data changes.