Discover Items in Excel with Ease: Quick Guide

Microsoft Excel is an indispensable tool in the world of data analysis, finance, and project management, offering numerous features that enhance productivity and streamline workflows. Among its many capabilities, the ability to discover, search, and filter items within spreadsheets stands out as one of the most vital functions for users who need to manage large datasets. This blog post will guide you through several techniques and features in Excel that will allow you to discover items with ease, enhancing your ability to find and manage data efficiently.
Mastering Excel’s Search and Find Features


At the heart of item discovery in Excel are its search capabilities:
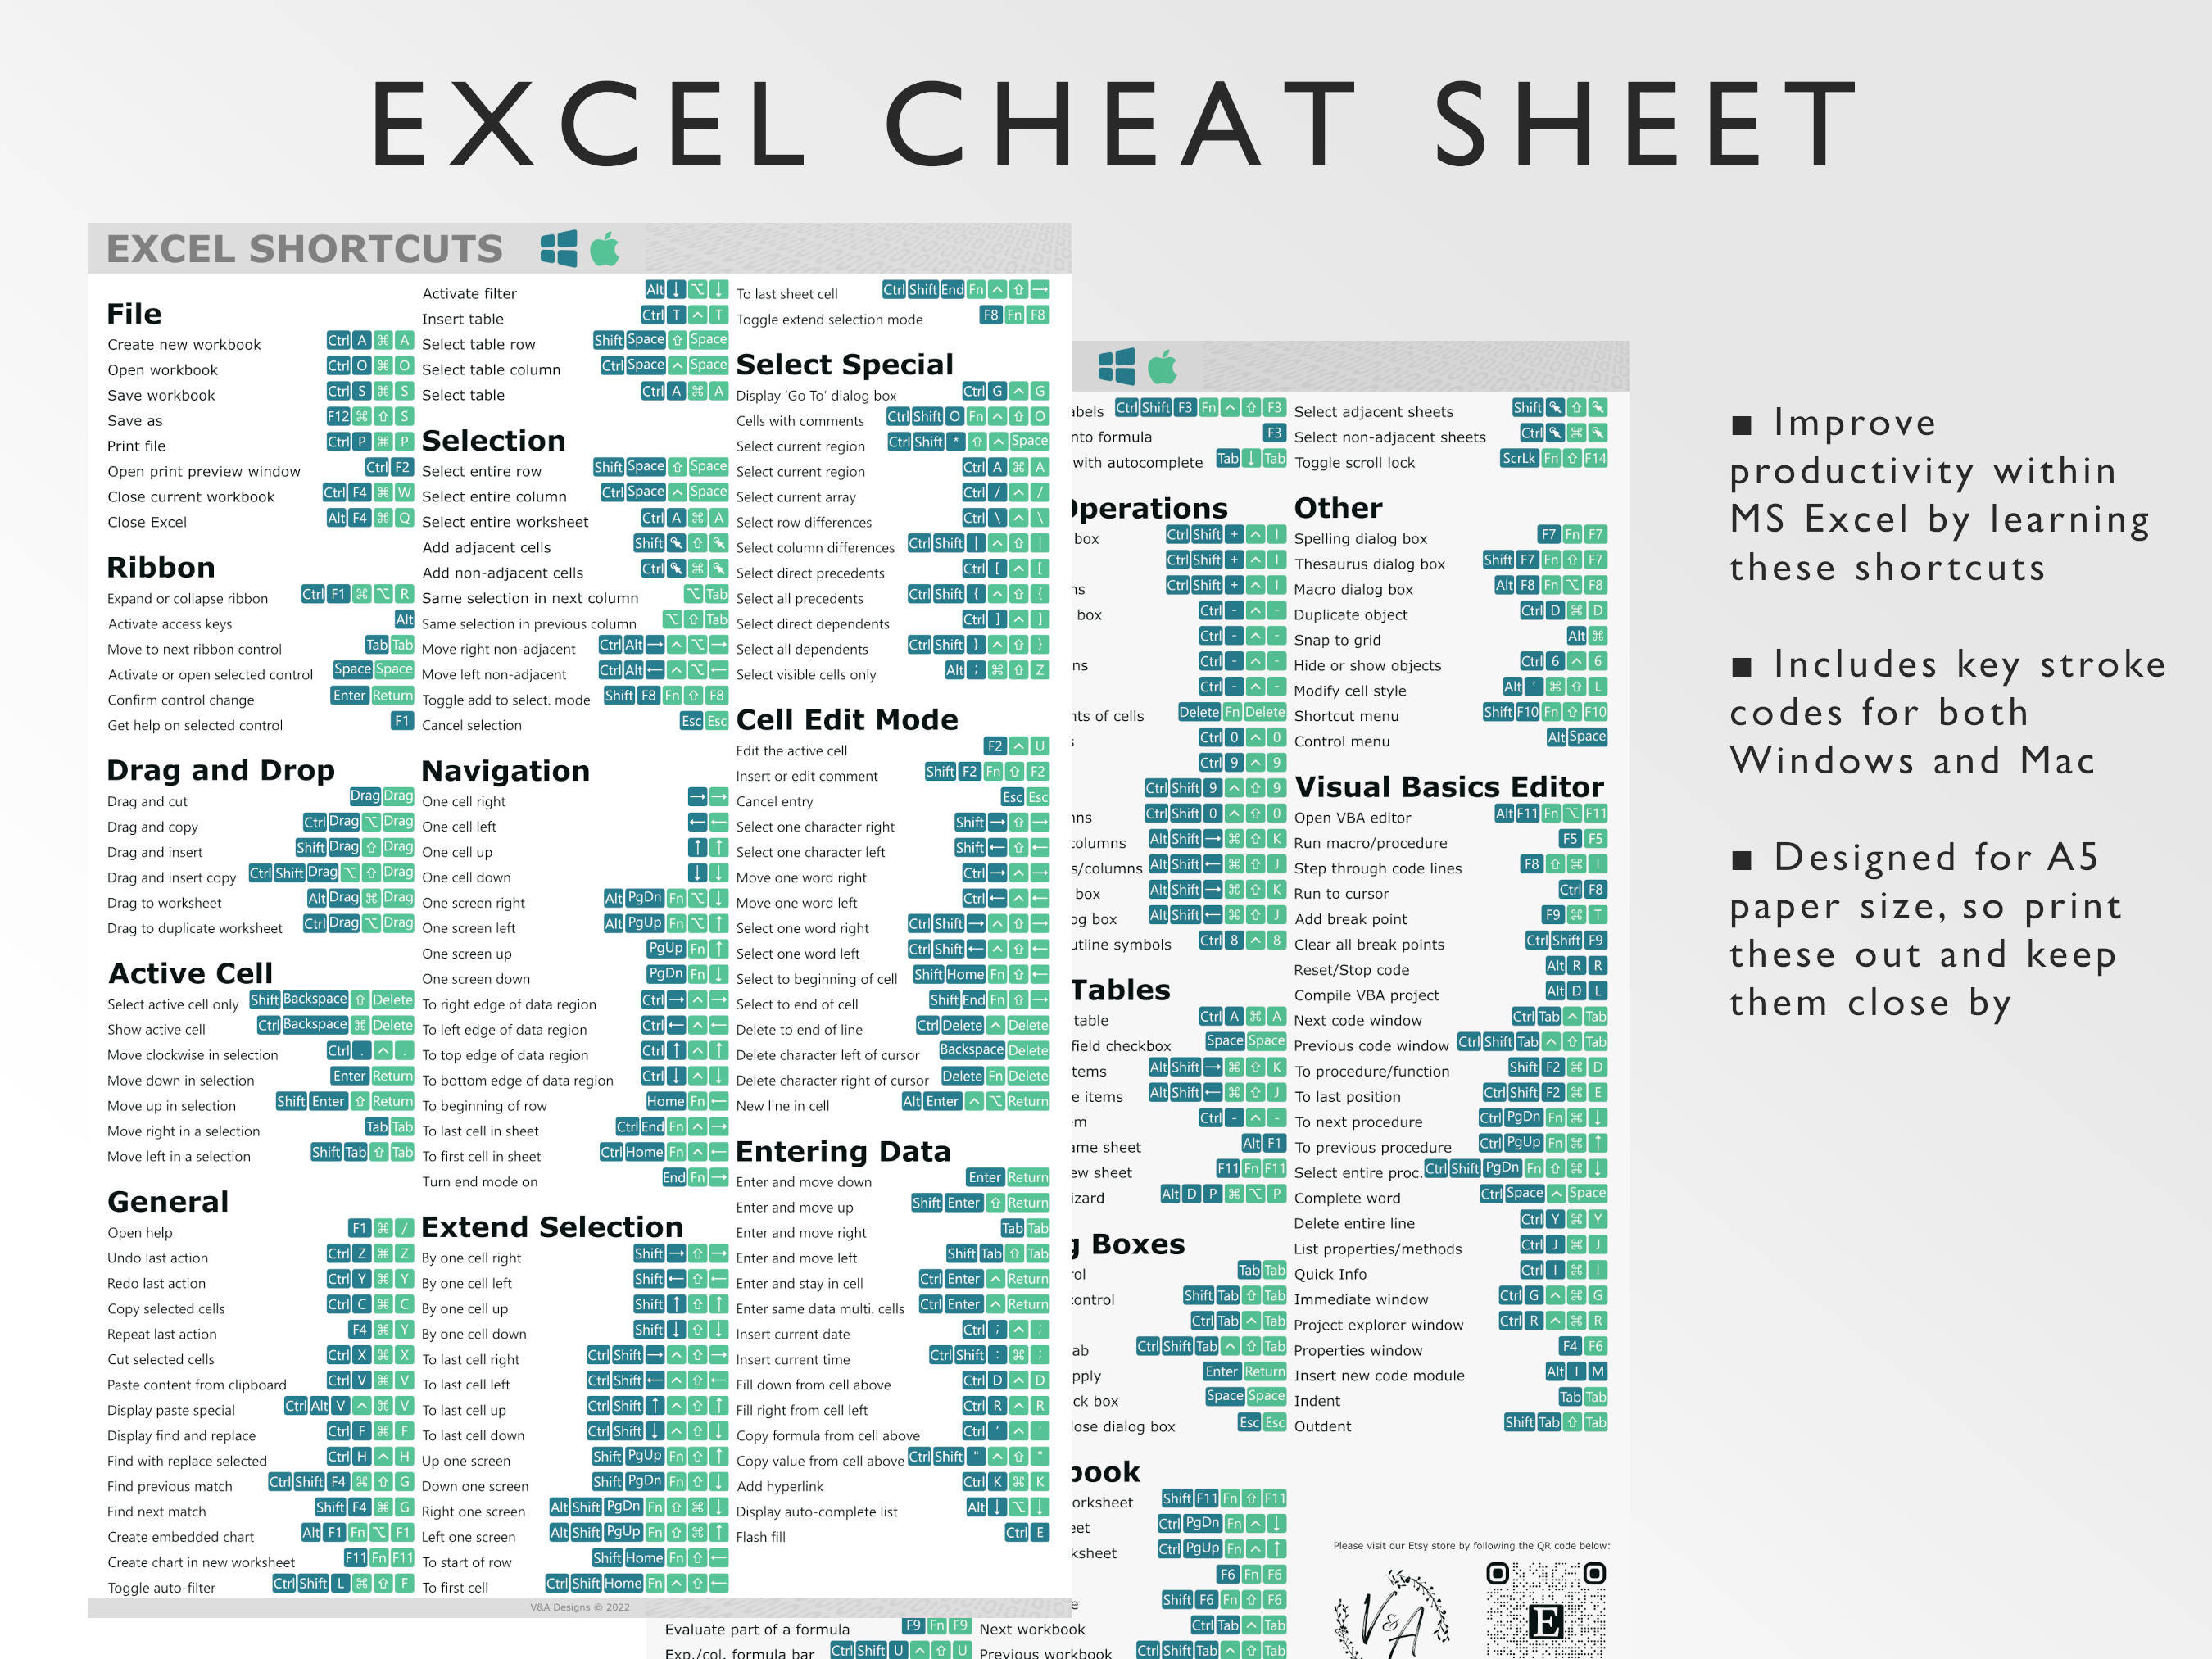
- Find Function (Ctrl+F): The Find function is the quickest way to locate a specific text or value in your spreadsheet. Open the Find and Replace dialog by pressing Ctrl+F or navigating to Home > Find & Select > Find.
- Wildcards: Use wildcards like * (asterisk) for any number of characters, or ? (question mark) for a single character to broaden or refine your search.
- Search within Formulas: Excel allows you to search within formulas, which can be particularly useful for identifying dependencies or errors.
These tools allow you to pinpoint data quickly, reducing the time spent manually scanning through sheets.
Advanced Filtering for In-Depth Data Analysis


When dealing with complex datasets, the following advanced filtering techniques can come in handy:
| Filter Technique | Description |
|---|---|
| AutoFilter | Basic filtering functionality to display only rows that meet specified criteria. |
| Custom Filters | Enhance AutoFilter with multiple conditions to display complex data subsets. |
| Advanced Filter | Allows for even more detailed criteria using formulas, can filter based on multiple columns. |
| Data Forms | Provides a form-based interface for navigating through records, making item discovery easier. |

Conditional Formatting to Highlight Important Data

While not a direct discovery method, conditional formatting can significantly enhance your ability to spot important data:
- Color Scales: Use gradients of colors to visually represent ranges of values.
- Data Bars: Add graphical bars within cells to show the value’s relative magnitude.
- Icon Sets: Implement icons that change based on cell values for quick visual analysis.
- Highlight Cells Rules: Set rules to highlight cells that meet specific criteria, like being above or below a threshold value.
By applying these rules, you can make your data visually intuitive, aiding in the discovery of patterns and outliers.
💡 Note: Remember that conditional formatting doesn’t modify the data itself but changes how data is displayed, which can help in identifying trends or anomalies for further analysis.
Utilizing Formulas and Functions for Data Discovery

Excel’s formulas and functions are powerful allies in your quest to manage and analyze data. Here are some functions to consider:
- VLOOKUP/HLOOKUP: These functions can look up and retrieve information from a specific column or row based on a matching value.
- INDEX and MATCH: An alternative to VLOOKUP that offers more flexibility and speed in lookup operations.
- IF Statements: Use logical tests to categorize data and find specific items based on criteria.
- Text Functions: Functions like LEFT, RIGHT, and MID can extract parts of text for pattern identification.
Formulas can automate the discovery process by dynamically filtering and retrieving data based on your evolving requirements.
Organizing Data with Pivot Tables


Pivot Tables are perhaps the most powerful tool for data discovery in Excel, offering the following benefits:
- Summarize and Explore: Group, sum, count, or average your data with ease.
- Filter, Sort, and Drill Down: Interact with your data by filtering, sorting, or diving into details of specific rows or columns.
- Create Custom Calculations: Add calculated fields or items to your Pivot Tables for more nuanced analysis.
🌟 Note: While Pivot Tables are an invaluable tool, they can sometimes be intimidating for beginners. Remember, you can always refresh the data or modify the pivot table at any time to suit your needs.
This journey through Excel's search, filtering, formatting, formulas, and Pivot Table capabilities has demonstrated how you can uncover and manage items in your spreadsheets with remarkable ease. Whether you're dealing with financial reports, scientific data, or managing project timelines, these techniques will streamline your data handling process, allowing you to make informed decisions faster. By mastering these tools, you'll not only save time but also uncover insights that might have remained hidden in your data's depths.
What is the difference between the Find and Replace functions in Excel?

+
The Find function in Excel is used to locate specific data within your spreadsheet. Replace, however, goes a step further by not only locating but also replacing the found items with new data, either one by one or all at once.
Can you explain the benefits of using Pivot Tables for data analysis?

+
Pivot Tables provide a dynamic way to summarize, analyze, and present large datasets. They allow you to pivot or rotate data, calculate summaries, filter, sort, and show or hide data points, making complex data analysis straightforward and visually digestible.
How can you filter data in Excel to focus on specific information?

+
Excel provides several ways to filter data, including AutoFilter for quick filters, Custom Filters for complex criteria, Advanced Filter for detailed filtering, and Data Forms for easier navigation. These techniques help you focus on specific data subsets to analyze or manage.