5 Ways to Filter Excel Rows Like a Pro

Are you struggling with organizing and analyzing data in Microsoft Excel? Whether you're dealing with large datasets or just need to streamline your work, Excel's row filtering capabilities can dramatically improve your productivity. In this blog post, we'll explore five advanced methods to filter rows in Excel like a pro. These techniques will not only save you time but also enhance your data analysis skills.
1. Using AutoFilter for Quick Filtering

Excel’s AutoFilter feature is your first line of defense when you want to quickly filter rows based on specific criteria:
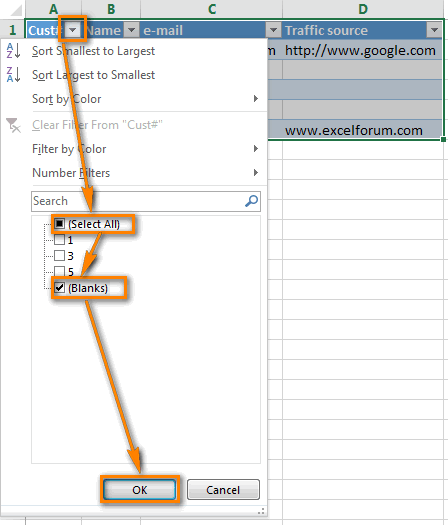
- Click the Filter Icon: Select any cell within your data range, go to the ‘Data’ tab, and click on ‘Filter’. This will add dropdown arrows to your column headers.
- Select Filter Options: Click on the arrow in the column header where you want to filter. Here, you can choose to filter by text, dates, or numbers.
- Using Search in Filter: If you’re looking for specific entries, use the search box within the filter menu for a more precise filter.
![]()
💡 Note: AutoFilter is great for basic filtering but remember, using it extensively on large datasets might slow down your workbook.
2. Custom Filtering with Advanced Criteria

When AutoFilter doesn’t cut it, dive into custom filtering:
- Select Advanced Filter: Go to ‘Data’ > ‘Sort & Filter’ > ‘Advanced’. This opens options to set complex criteria.
- Set Criteria: You can filter rows by specifying conditions in a criteria range or directly in the dialog box. For example, filtering rows where the value in column A is greater than 100 and less than 200.
- Unique Records: You can also use Advanced Filter to extract unique records from your dataset.
| Field | Criteria | Description |
|---|---|---|
| Column A | >100, <200 | Filter rows where the value is between 100 and 200 |
| Column B | =Excel* | Filter rows where the entry starts with 'Excel' |

3. Leveraging Excel Functions for Filtering

Excel functions like FILTER, introduced in Excel 365 and Excel 2019, provide dynamic filtering:
- FILTER Function: Syntax -
=FILTER(array, include, [if_empty])- array: The range of cells or array to filter.
- include: A Boolean array or expression indicating which rows to include.
- if_empty: Optional argument to return when no rows meet the criteria.
- Example: If you want to filter rows where the value in Column A is greater than 100, you would write:
=FILTER(A2:C10, A2:A10>100)
🔍 Note: This function updates automatically as data changes, making it dynamic and extremely useful for live data analysis.
4. Data Slicers for Interactive Filtering

For those looking to add an interactive touch to their Excel workbooks, slicers are a great tool:
- Insert a Slicer: Select your data range or table, go to the ‘Insert’ tab, and choose ‘Slicer’. Select the columns you want to filter.
- Filter with Slicers: Click on the slicer buttons to filter data. Multiple slicers can be used for cross-filtering.
Here's how to customize slicers for a more professional look:
- Right-click the slicer and select 'Slicer Settings' to rename.
- Adjust slicer styles under 'Slicer Tools > Options'.
- Change the slicer's dimensions to better fit your workbook layout.
🌟 Note: Slicers are especially useful for dashboards and reports where quick visual filtering can enhance user interaction.
5. Using Power Query for Advanced Data Filtering

Excel’s Power Query (formerly known as Get & Transform) provides robust filtering options:
- Import Data: Use ‘Get Data’ to load your data into Power Query.
- Filter Steps: In the Query Editor, you can apply filters directly to columns. Right-click on the column header and choose from various filter options.
- Advanced Filtering: Use M language to write custom filtering logic for complex scenarios.
- Load Filtered Data: Once you’ve filtered your data, load it back into Excel for further analysis or use Power Query’s additional transformation steps.
In summary, by employing these advanced filtering methods in Excel, you can transform raw data into meaningful insights with greater efficiency. From simple AutoFilters to the dynamic capabilities of Power Query, Excel offers a range of tools suited for different needs and skill levels. Each method has its unique advantages, and understanding when to use which can significantly improve your data handling proficiency.
What’s the difference between AutoFilter and Advanced Filter?

+
AutoFilter allows quick filtering based on cell values, while Advanced Filter provides the ability to set complex criteria or unique records filtering, offering more customization options.
Can Excel filter rows based on the color of the cells?

+
Yes, Excel can filter rows by cell color using the ‘Filter by Color’ option within the filter dropdown. This is useful for highlighting data visually.
What are slicers in Excel, and how do they differ from regular filtering?

+
Slicers are visual tools for filtering data in tables, PivotTables, or Excel tables. Unlike regular filters which are dropdown menus, slicers provide a graphical interface, making data filtering more intuitive and interactive.
Is it possible to filter rows across multiple worksheets at once?

+
Yes, by using the ‘Consolidate’ feature or Advanced Filter with named ranges, you can filter data from multiple sheets into one location.
How can I automate filtering processes in Excel?

+
You can automate filtering through VBA (Visual Basic for Applications). By writing macros, you can create custom commands to apply filters, making repetitive tasks more efficient.