How to Filter Excel Sheet by Color Easily

One of the most visual ways to categorize or distinguish data in an Excel sheet is by using color. Whether these colors are applied manually to highlight specific entries, or automatically by conditional formatting, knowing how to filter by color in Excel can significantly enhance your data analysis capabilities. In this guide, we'll explore various methods to filter your Excel spreadsheets based on color, making it easier to manage and analyze complex datasets.
Understanding Color Filtering in Excel

Excel offers a feature known as filtering, which allows users to quickly narrow down the data view according to specific criteria, including colors. Here are some key points about color filtering:
- It's possible to filter by cell color, font color, or icon set.
- Color filtering can be applied to both manually applied colors and those set by conditional formatting rules.
- Color filters are an easy way to visually manage and process large volumes of data without altering the underlying dataset.
How to Filter by Cell Color

Here's a step-by-step guide on how to filter your Excel sheet by cell color:
- Open Your Spreadsheet: Load the Excel file where you want to apply the color filter.
- Select the Data Range: Click on the header of the column you want to filter, or select an area including the headers.
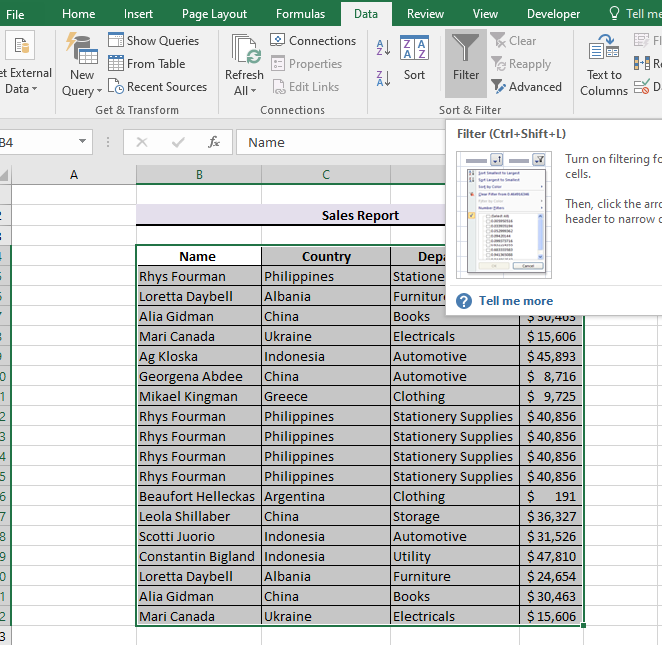
- Activate the Filter: Go to the Data tab on the Ribbon, and click Filter in the Sort & Filter group. Little arrow icons will appear next to each column header.
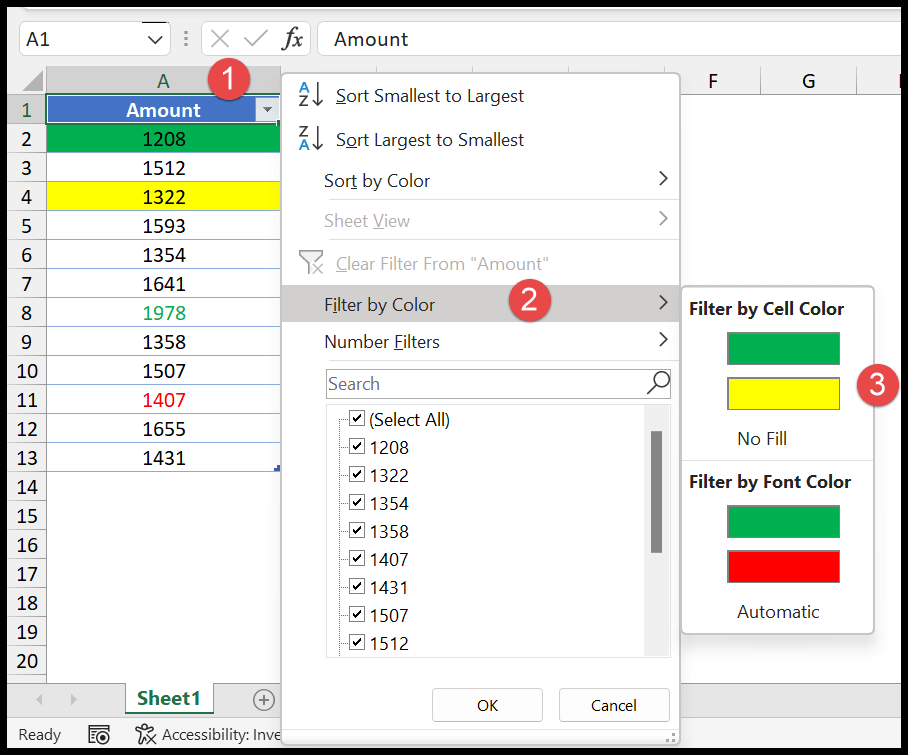
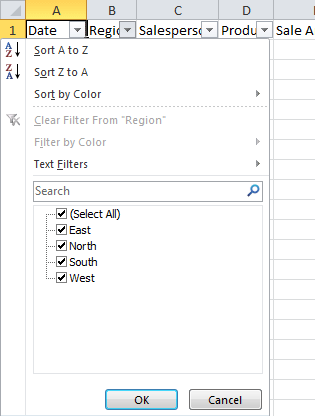
- Choose Your Filter: Click the dropdown arrow of the column you're interested in filtering.
- Select Filter Options:
- From the dropdown menu, choose Filter by Color.
- Then select either Cell Color or Font Color depending on what you've used to categorize your data.
- From the palette, select the color you wish to filter by.
✨ Note: If you have multiple shades or tones, you'll need to filter by each unique color individually.
Filtering by Conditional Formatting Color

If your data is colored through conditional formatting rules, follow these steps:
- Ensure Conditional Formatting is Applied: Make sure your conditional formatting is correctly set up with the colors you wish to filter by.
- Open Filter Menu: Click on the dropdown arrow in the column's header where you applied conditional formatting.
- Choose Filter: Under the Filter options, you'll find your conditional formatting criteria, which you can select to filter the data based on the color rules.
✨ Note: Filtering by conditional formatting color might not work if the cells have been manually recolored over the conditional formatting color.
Handling Data Once Filtered

Once you've filtered your data by color:
- You can analyze the filtered subset of your data.
- Select and copy filtered data if you need to move it elsewhere or perform further analysis.
- Turn off filters to return to the full dataset.
Advanced Tips for Filtering by Color

Here are some advanced techniques to enhance your color filtering experience:
- Combine Filters: You can apply multiple filters, not just by color, but also by value or date range, to get even more specific results.
- Sort: After filtering, you can sort the filtered data by color or other criteria for better visualization.
- Color Consistency: Ensure consistent color application if you're filtering based on manual coloring, otherwise, you might miss or misinterpret data.
- Use Tables: If your data is in an Excel Table, filtering by color becomes more intuitive since the headers are already formatted for easy filtering.
| Feature | Description |
|---|---|
| Manual Cell Color | Apply color manually to cells to categorize or highlight specific entries. |
| Conditional Formatting | Automatically color cells based on specific rules or criteria. |
| Filtering by Color | Filter out data based on the color of the cell or font. |
| Sort by Color | Sort your filtered data for better visual analysis. |

In conclusion, color filtering in Excel provides a powerful yet simple way to manage, analyze, and interpret large datasets. By using these methods, you can efficiently process data based on visual cues, making your analysis tasks not only easier but also more insightful. Remember, the key to successful color filtering lies in consistent application and understanding of how Excel handles color-related data manipulations. Keep exploring Excel's features to unlock even more data management and analysis techniques!
Can I filter by multiple colors at once?

+
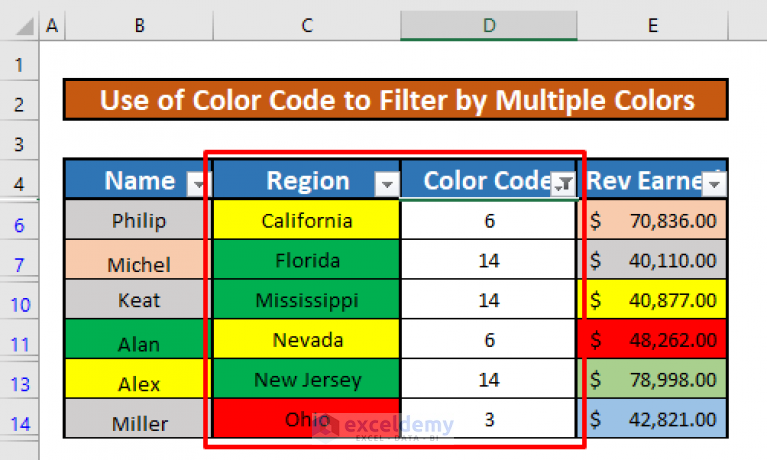
Yes, you can filter by multiple colors. However, Excel does not support selecting multiple colors in one step. You would need to filter by one color at a time, and the subsequent filters will be applied to the already filtered data.
Do color filters affect the actual data in the cells?

+
No, filtering by color does not change or affect the actual data within the cells. It merely changes what you see by hiding or showing rows based on the color criteria you’ve set.
Can I apply filters to data in an Excel Table?

+
Yes, Excel Tables support filtering by color, and it’s often easier to apply filters to tables since they come with built-in header dropdowns for quick data management.