Enter Questionnaire Data in Excel: Quick Guide

Managing data efficiently is crucial for any business or personal project, and Excel is a powerful tool designed for exactly this purpose. Whether you're a novice or a seasoned Excel user, understanding how to input, organize, and utilize data effectively can significantly enhance your productivity. This guide will walk you through the essentials of entering questionnaire data into Excel, offering practical tips and best practices to make the process as smooth as possible.
Preparation for Data Entry
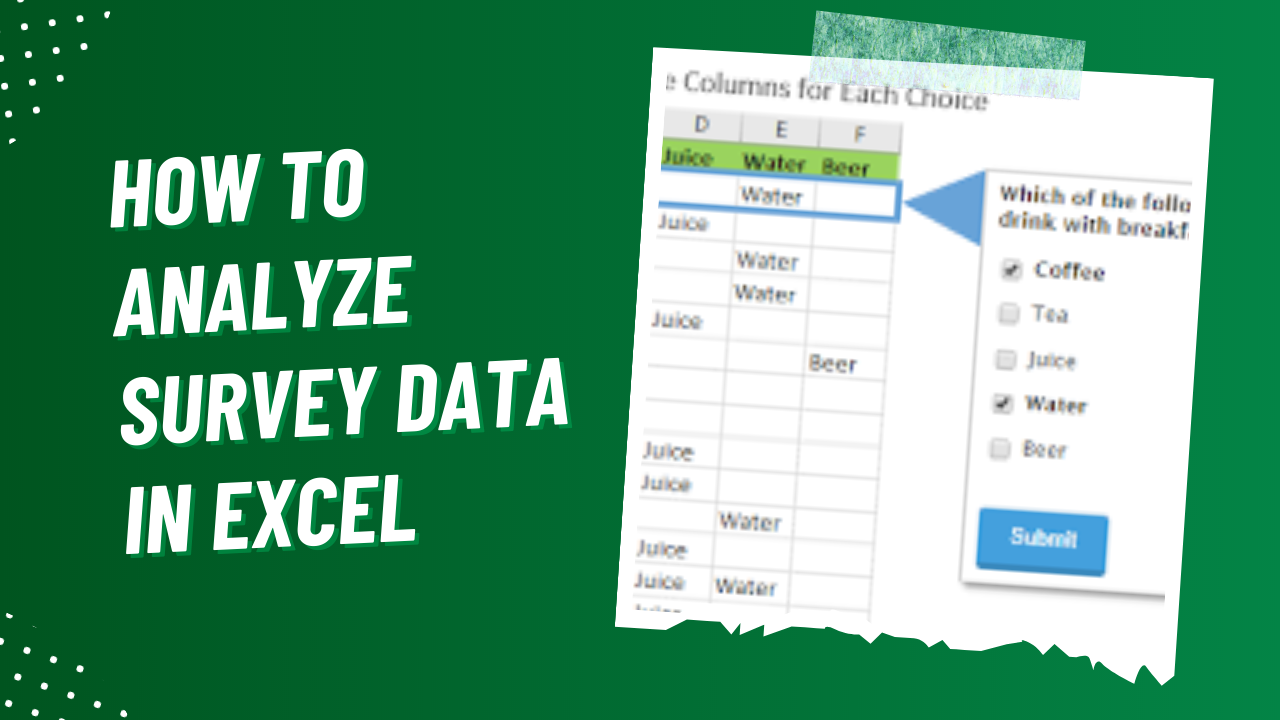
Before diving into Excel, taking some preliminary steps can greatly improve your data entry experience:
- Gather Your Data: Ensure you have all your questionnaire responses, whether they are paper forms or digital entries, ready for transcription.
- Plan Your Spreadsheet Layout: Decide how you want your data structured. What will be your columns? How will you categorize your responses?
Entering Data into Excel
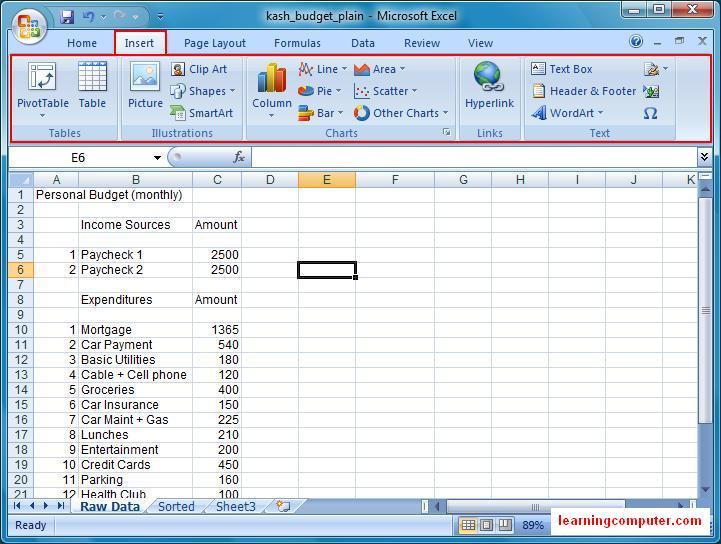
To begin entering your questionnaire data:
- Open Microsoft Excel: Start with a blank worksheet or use an existing template if available.
- Create Headers: In row 1, enter column titles based on your questionnaire questions or themes. Use short, descriptive headers like "Name", "Email", "Age", "Gender", etc.
- Data Entry:
- Select a cell in row 2 and start entering your first respondent's data. Press Enter or Tab to move to the next cell.
- Continue entering data row by row for each respondent.
- Data Validation: Use Excel's data validation feature to ensure only the right type of data goes into each column, reducing errors. For example, setting drop-down lists for gender or age ranges.
🖌️ Note: Keep your entries consistent. For instance, if you're collecting dates, use a uniform format like DD/MM/YYYY.
Formatting Your Data
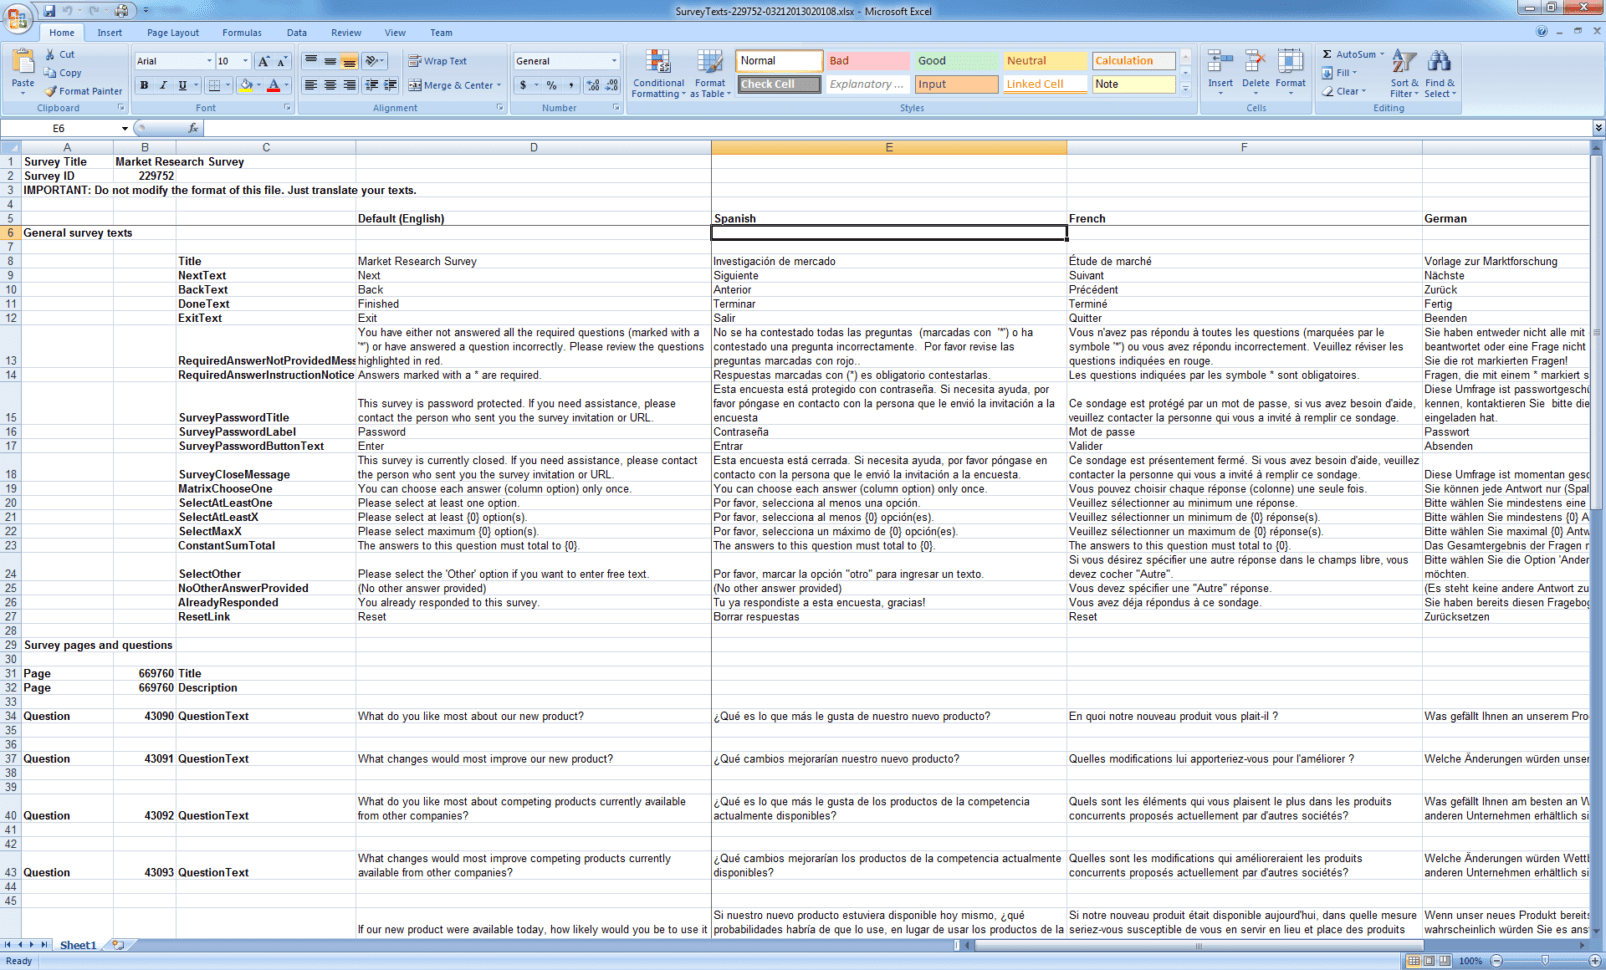
Once you've entered the data, proper formatting can make your spreadsheet both easier to read and more functional:
- Adjust Column Width: To make sure all data is visible, adjust the width of your columns by dragging the column boundary or by right-clicking, selecting "Column Width".
- Formatting Cells:
- Select cells or ranges for formatting. Use Ctrl+1 to open the Format Cells dialog.
- Apply number formats, text alignment, or color to make data stand out.
- Freeze Panes: If your data goes beyond the screen, freeze the header row to keep it visible as you scroll. Go to "View" > "Freeze Panes".
| Feature | How to Use |
|---|---|
| Conditional Formatting | Highlight cells based on conditions like 'Text Contains' or 'Duplicate Values'. |
| Sorting & Filtering | Sort data by clicking on column headers. Use Filter in 'Data' tab to manage what you see. |
| Formulas and Functions | Utilize SUM, COUNT, AVERAGE to derive insights from your data. |
🔍 Note: Conditional formatting can automatically color-code your data based on the values entered, making it easier to spot trends or outliers.
Data Analysis

With your data properly entered and formatted, you can now delve into analysis:
- Descriptive Statistics: Use the 'Data Analysis' tool for summary statistics like mean, median, mode, and standard deviation.
- Charts and Graphs: Visualize your data with pie charts, bar graphs, or line graphs to better understand trends.
- Pivot Tables: Create pivot tables to summarize, explore, and analyze large data sets, especially useful for cross-tabulation.
Advanced Features
To get the most out of Excel:
- Data Validation for Questionnaire Responses: Control what data goes where with custom drop-down lists or rules for text or numbers.
- Macros and VBA: Automate repetitive tasks or complex calculations with VBA scripts.
⚙️ Note: Macros can significantly speed up your work, but be cautious with security settings when using macros from external sources.
Entering questionnaire data into Excel is a foundational skill that can unlock powerful data analysis capabilities. With the right approach to data entry, formatting, and analysis, you can transform raw data into actionable insights. Whether you're organizing a small survey or managing large-scale data collection, Excel provides the tools necessary to handle the task efficiently. This guide has equipped you with the basics and some advanced techniques to ensure you can make the most out of your questionnaire data, offering a structured and insightful way to manage and interpret information.
How do I prevent data entry errors in Excel?

+
Use data validation to set rules for what kind of data can be entered into specific cells, and apply conditional formatting to highlight potential mistakes. Regular reviews and double-checking can also help maintain data integrity.
What are the best practices for naming columns?

+
Keep column headers short, clear, and consistent. Avoid spaces in headers to ease formula application, and ensure they’re descriptive to reflect the data beneath them.
Can I automate data entry with Excel?

+
Yes, with VBA (Visual Basic for Applications) you can automate repetitive tasks or even create user forms for data entry, reducing manual input errors and speeding up the process.