3 Simple Ways to Draw a Vertical Line in Excel

Microsoft Excel is a powerful tool used by millions for organizing, analyzing, and presenting data. Whether you're managing financials, tracking inventory, or visualizing project timelines, one basic yet often overlooked feature is the ability to draw lines, particularly vertical lines, to enhance the clarity of your data presentation. Here, we will explore three simple methods to draw a vertical line in Excel, each suited for different scenarios and levels of Excel proficiency.
Method 1: Using Borders

One of the simplest ways to create a vertical line in your worksheet is by using Excel’s built-in borders feature. This method is straightforward and works well when you need to divide columns visually:
- Select the cells where you want the vertical line to appear.
- Go to the Home tab on the Ribbon.
- Click on the Borders drop-down arrow in the Font group.
- Choose Inside Borders or Vertical Line from the list to add a vertical line.
💡 Note: You can also customize the line style, color, and thickness to match your report's theme.
Method 2: Using Shapes

For a more flexible approach, you can insert shapes into your Excel worksheet to create vertical lines:
- Navigate to the Insert tab.
- Click on Shapes and select the Line tool from the Lines section.
- Click and drag on the worksheet where you want the line to be placed. Hold down the Shift key to ensure the line is perfectly vertical.
This method allows for:
- Customizable line width and color.
- Easy movement and resizing of the line without affecting the cell data.
- The ability to overlay the line on top of cell content for better visibility.
Method 3: Using Cell Formulas and Charting

While this method might seem advanced, it leverages Excel's formula capabilities to insert vertical lines into charts, which can be particularly useful for data visualization:
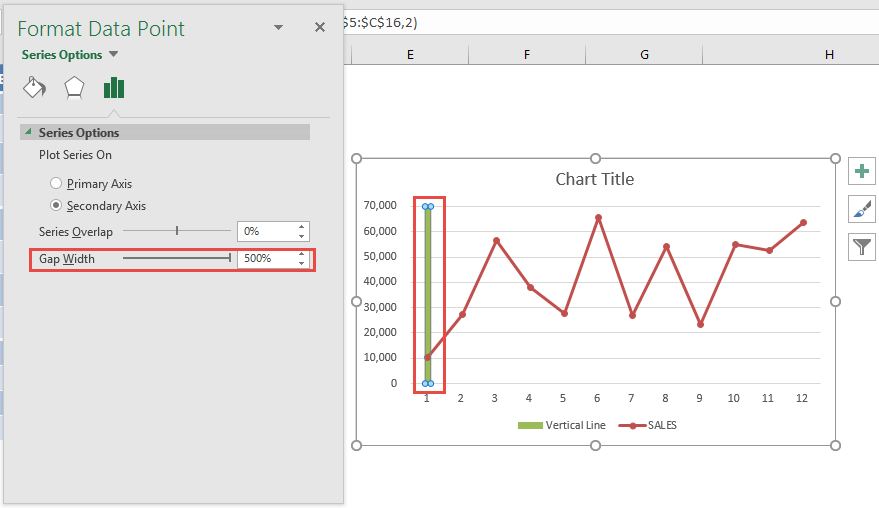
- Create or select a column chart where you want the vertical line.
- Insert a series of zeros for a new column in your data range. This series will represent the Y-axis values where the vertical line will appear.
- Use the
=NA()function in your X-axis series at the point where you want the line to break, ensuring it does not connect with the rest of the chart. - Format the zero data points to show lines and customize their appearance:
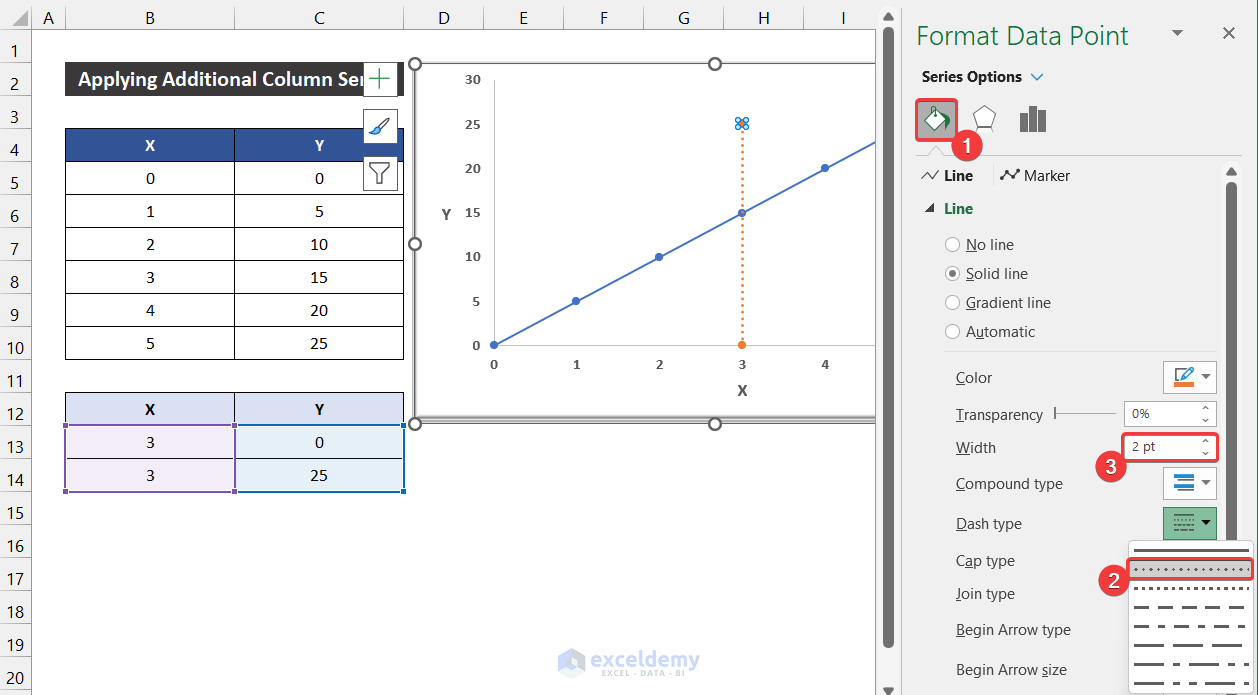
- Right-click on any chart data series.
- Choose Format Data Series.
- Under Line, select the options for the vertical line.
📘 Note: This method involves some manual chart editing and might require adjusting the chart's layout for the line to appear precisely where needed.
Choosing the Right Method

Each method has its advantages:
- Borders are ideal for quick, simple separations in table-like data.
- Shapes offer greater flexibility for custom designs and presentations where you might need lines outside of a table grid.
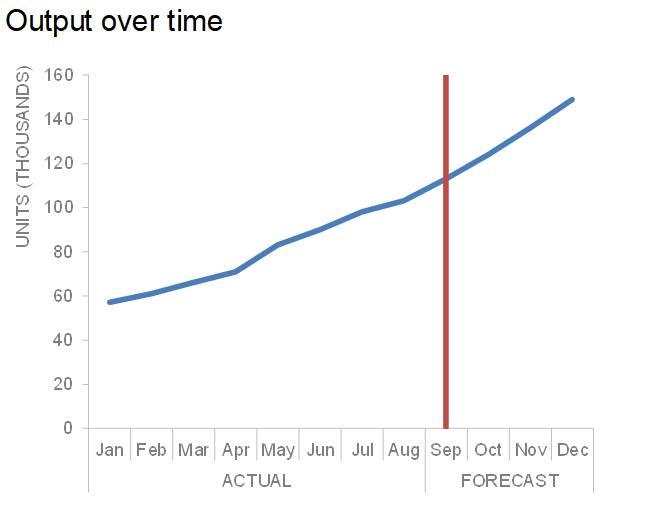
- Charting is best for adding context to data visualizations where a line signifies a specific event or threshold.
Now that you're equipped with these methods, you can enhance the visual appeal of your Excel spreadsheets or charts with vertical lines to convey information more effectively. Remember, the key is to choose the method that best fits your data's context and the message you wish to convey.
To wrap up, drawing vertical lines in Excel can be done in several ways, each serving different purposes. Whether you're delineating data, creating visual separators, or marking specific points in your charts, these techniques will elevate your Excel work, making it not only more professional but also clearer and more intuitive for viewers.
Can I change the style of the vertical line in Excel?

+
Yes, you can customize the appearance of your vertical lines. For borders or shapes, you can choose the line style, color, and thickness through the ‘Format Cells’ dialog or by adjusting the shape properties. In charts, you can format the line series for more control over its look.
What if I need a dynamic vertical line in a chart?

+
To create a dynamic vertical line, you would need to use named ranges that update automatically when data changes. Then, you could adjust the series formula in the chart to refer to these dynamic ranges, ensuring the line moves as per the new data.
Is there a keyboard shortcut to draw lines in Excel?

+
There is no direct keyboard shortcut for drawing lines, but you can speed up the process by setting a quick key for opening the Shapes gallery or customizing borders through ribbon customization.