Draw Line Graphs in Excel: A Simple Guide

Creating line graphs in Microsoft Excel provides a visually effective way to present trends over time, making complex data easily digestible. Whether you're tracking sales, analyzing temperature fluctuations, or monitoring website traffic, line graphs can be indispensable tools for your data analysis.
What is a Line Graph?

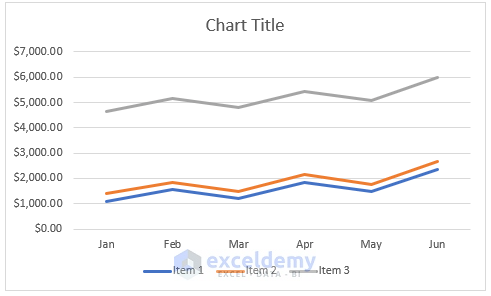
A line graph, sometimes referred to as a line chart, is a type of chart that displays information as a series of data points connected by lines. It’s particularly useful for visualizing continuous data, showing how one or more variables change over time.
Why Use Line Graphs?

Here are several reasons why you might choose to use line graphs in your data analysis:
- Show Trends: They excel at highlighting trends, patterns, and changes in data over specific intervals.
- Compare Data: Line graphs can compare changes over the same period for different data sets.
- Track Progress: They are ideal for visualizing progress or performance against goals or benchmarks.
Steps to Create a Line Graph in Excel

Gather Your Data

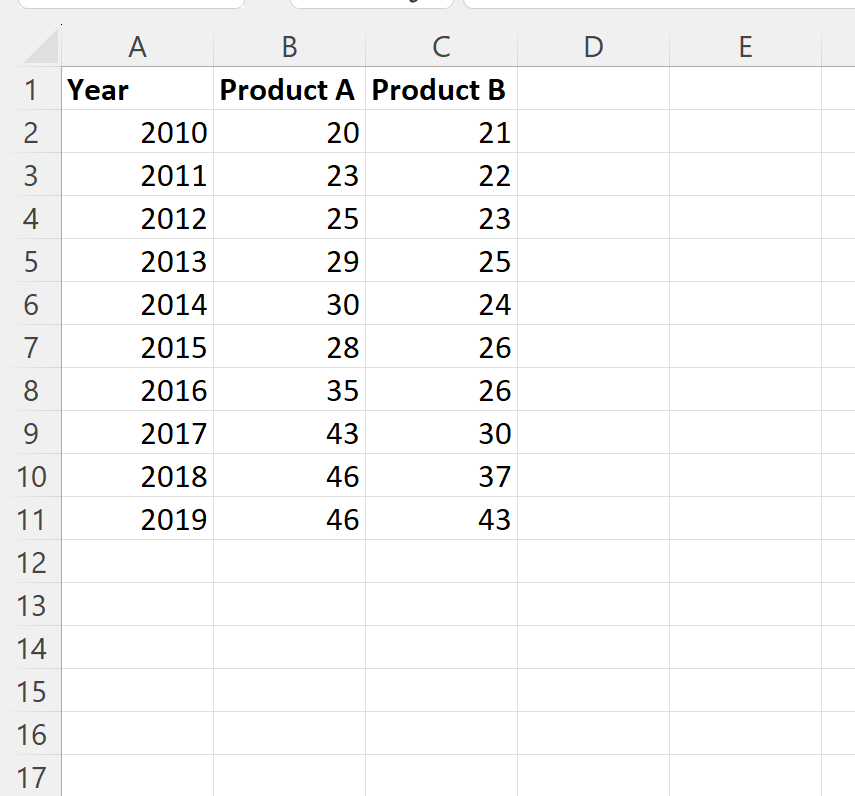
Ensure that your data is properly organized in rows or columns. Typically, time-based data goes in one column (e.g., dates), with the variable you’re tracking in the next column:
| Date | Sales |
|---|---|
| Jan 1 | 50 |
| Jan 2 | 60 |
| Jan 3 | 45 |

🔍 Note: Ensure your time series data is sorted chronologically for accurate representation.
Select Your Data

Click and drag to highlight the cells with the data you want to graph.
Insert the Line Graph

- Go to the Insert tab.
- In the Charts section, click on the Line or Area chart icon.
- Choose a line chart style (like Line with Markers or Stacked Line).
💡 Note: The chart style you select will depend on what kind of comparison or trend you want to emphasize.
Customize Your Graph

- Change Colors: Right-click on the line and select “Format Data Series” to modify colors and styles.
- Modify Axis Labels: Click on the axes to adjust the labeling, like date format or scaling.
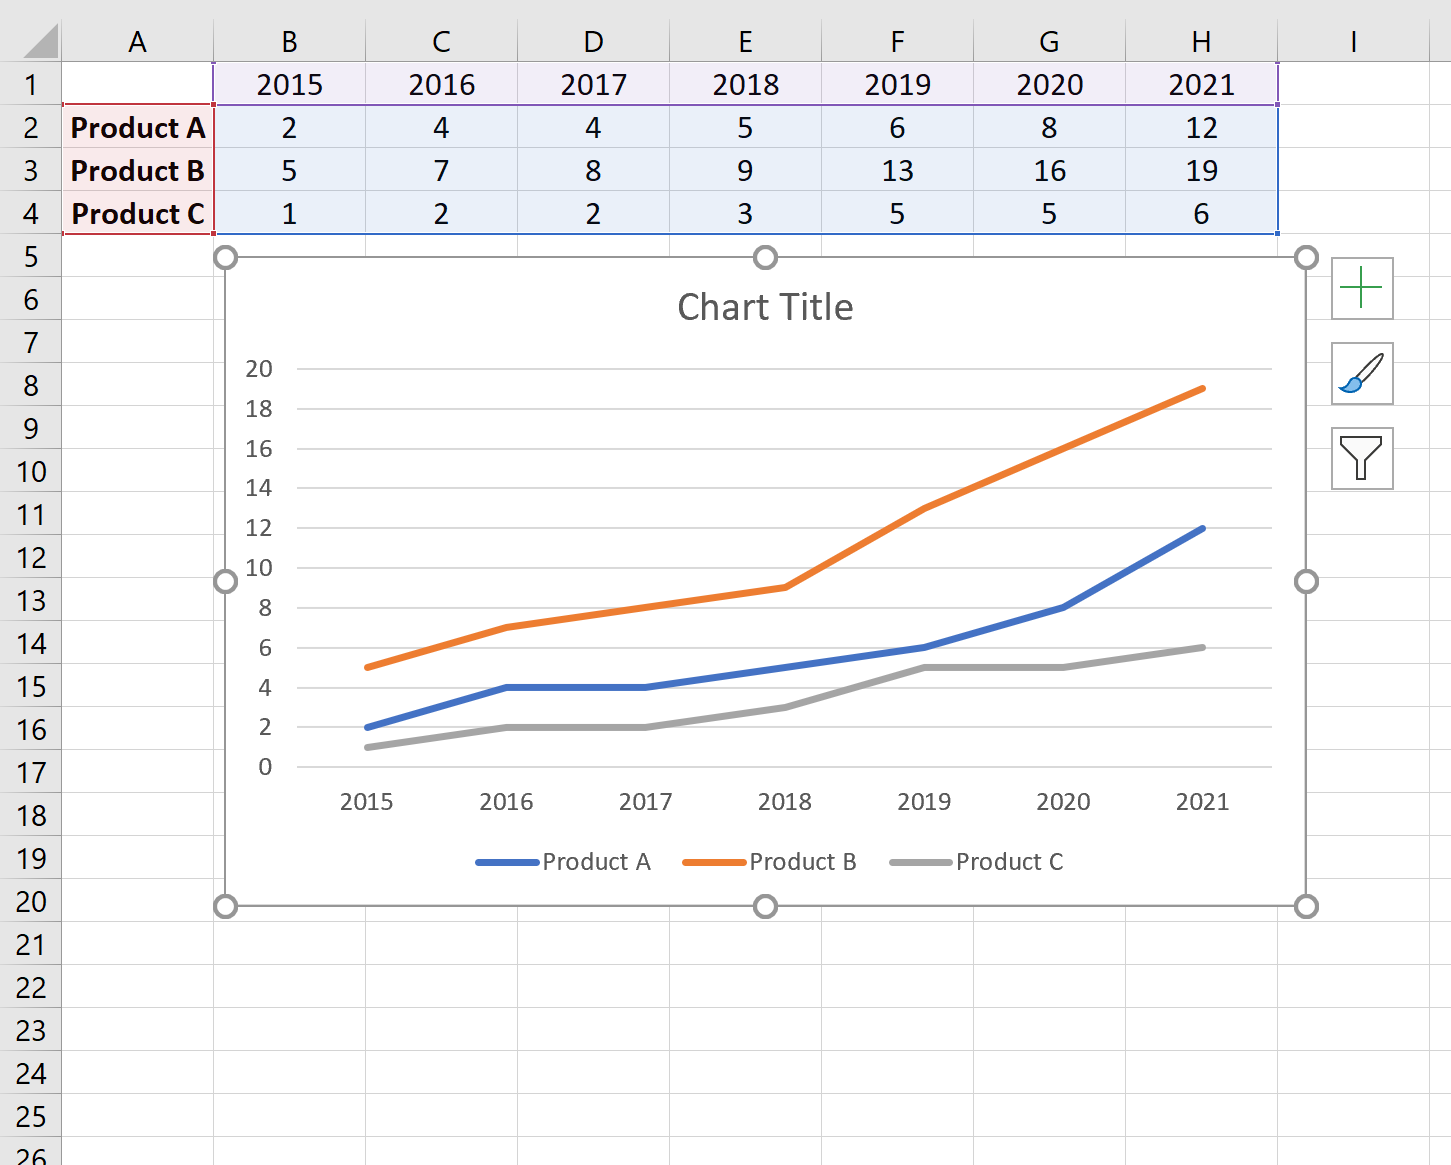
- Add a Chart Title: Click on “Chart Elements” (the plus sign next to your chart) and check “Chart Title” to add and edit.
- Legend: You can add, remove, or reposition the legend from the same “Chart Elements” menu.
Final Touches

Make sure your graph is not only informative but also visually appealing:
- Check for any overlap in labels or lines.
- Adjust gridlines for better readability.
- If needed, insert trend lines to forecast future data points or highlight trends.
Things to Consider When Creating Line Graphs

Data Accuracy

Ensure your data is accurate and the correct range is selected. This affects how the line graph represents the information.
Legibility

Keep the graph simple:
- Don’t overcrowd the graph with too many data series.
- Make sure all text is legible.
- Avoid using similar colors for different data sets to maintain distinction.
Proper Scaling

Pay attention to the scale of your axes:
- If the scale is too large or too small, trends might not be accurately portrayed.
- Consider if a log scale would be appropriate for exponential data.
In this comprehensive guide, you’ve learned the basics of creating line graphs in Excel, understanding why they are useful, and how to customize them for better analysis and presentation. Remember that the key to an effective line graph lies in clean data organization, thoughtful customization, and ensuring the graph communicates the story behind your data accurately and clearly.
Can I add multiple data series to a single line graph?

+
Yes, you can add multiple data series to a line graph in Excel by selecting all the relevant data before inserting the chart. Each data series will be plotted as a separate line on the graph.
How do I change the scale of the Y-axis?

+
Right-click on the Y-axis, select “Format Axis,” and adjust the scale settings to your needs, whether you want to change the minimum or maximum values, the units, or switch to a logarithmic scale.
What if my data isn’t in chronological order?
+You’ll need to sort your data by date or time before creating the line graph. Use Excel’s sorting feature to organize your data. Graphs will then accurately represent the time series data.