7 Steps to Crafting a Balance Sheet in Excel

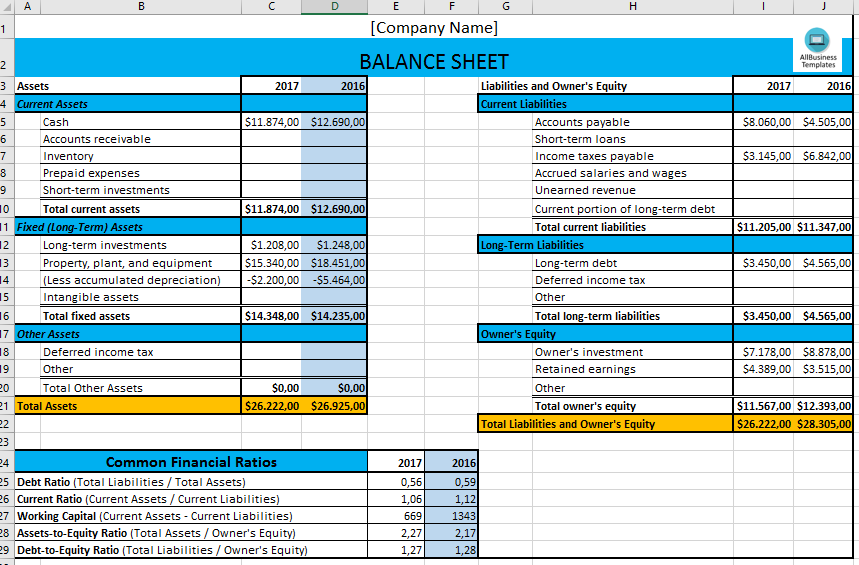
Creating a balance sheet in Microsoft Excel is a fundamental task for anyone involved in accounting, finance, or business management. This document provides an overview of your business's financial health by detailing assets, liabilities, and equity. Here are the detailed steps to guide you through the process:
1. Understand the Components

- Assets: What your business owns.
- Liabilities: What your business owes.
- Equity: The owner’s claim on the business after liabilities are subtracted from assets.
2. Set Up Your Excel Workbook
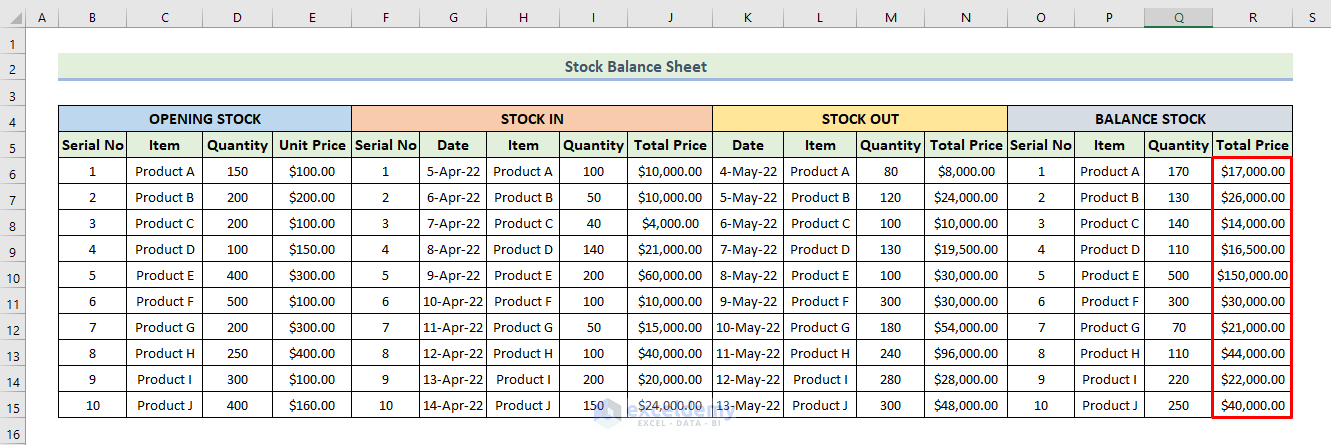
Open a new Excel workbook:
- Rename the first sheet to “Balance Sheet.”
- Make sure Excel is set to not overwrite data when pasting cells; select Paste Special > Values to maintain formatting.

3. Create Headers and Labels
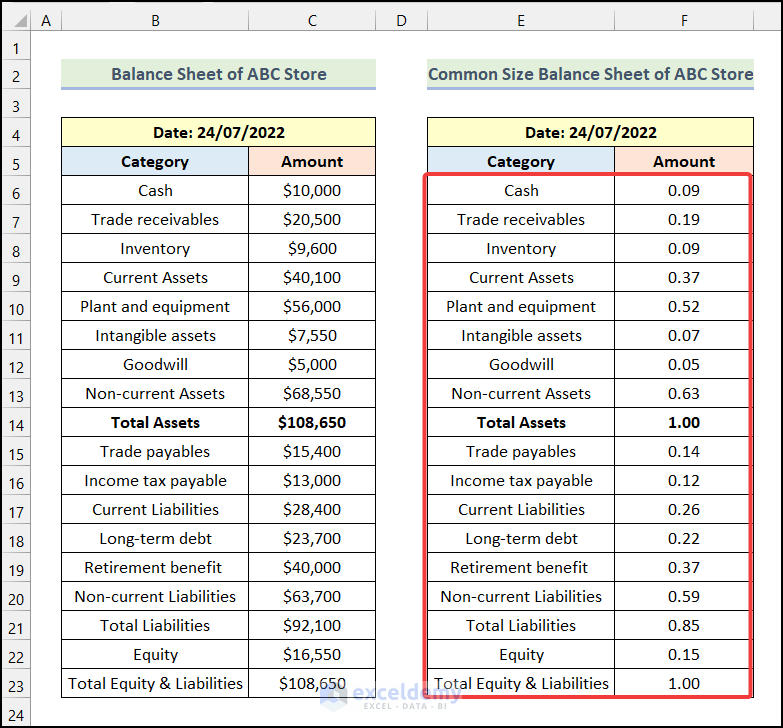
Include the following headers:
| Header | Description |
|---|---|
| A1 | Company Name |
| A2 | Balance Sheet |
| A3 | Date |
| A4 | Assets |
| B4 | Amount ($) |

Continue creating labels for sub-categories of assets, liabilities, and equity.
4. Enter Data

Populate the following items:
- Assets: Current assets (cash, accounts receivable), fixed assets (property, equipment).
- Liabilities: Current liabilities (accounts payable), long-term liabilities.
- Equity: Owner’s equity, retained earnings, and any other equity components.
5. Format and Calculate

Format your balance sheet to enhance readability:
- Use bold for headers and sub-headers.
- Apply currency format to the Amount column.
- Set up total and subtotal rows for each category and use formulas to sum up the relevant cells.
🔍 Note: Use conditional formatting to highlight important figures or anomalies for better analysis.
6. Check for Errors
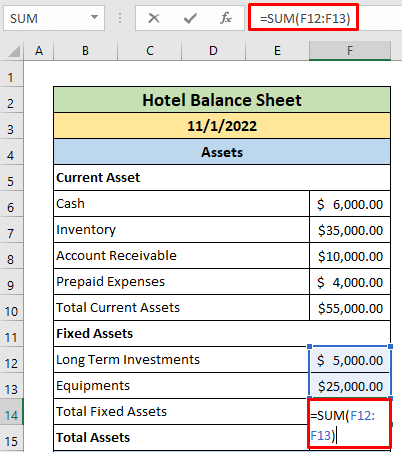
Perform a final review:
- Ensure all figures balance; total assets should equal total liabilities plus equity.
- Use Excel’s formula auditing tools to trace errors or missing calculations.
🔍 Note: Always verify that the sum of assets equals the sum of liabilities plus equity to ensure accuracy.
7. Present and Analyze
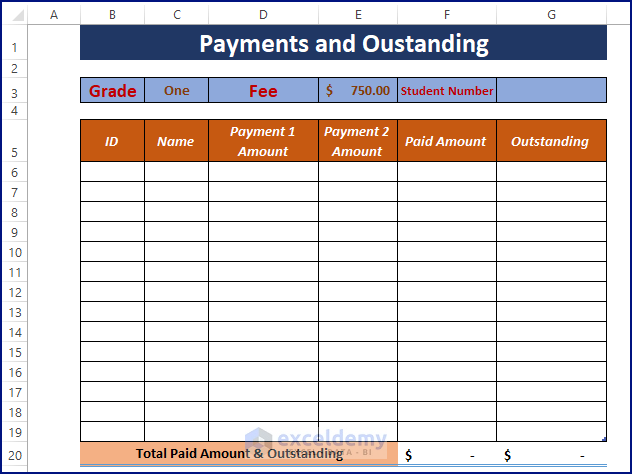
Utilize Excel features for better presentation:
- Create charts or graphs to visualize key financial ratios or trends.
- Ensure that your Excel balance sheet is formatted professionally to share with stakeholders or for internal reporting.

🔍 Note: Excel allows you to easily export your balance sheet into PDF or other formats for external sharing.
By following these steps, you can construct a balance sheet in Excel that not only displays your company's financial position accurately but also serves as an invaluable tool for financial analysis and decision-making. This systematic approach ensures that your balance sheet is not only organized but also reflects the true financial health of your business, allowing for strategic insights into its strengths and areas for improvement.
Why is it important for assets to equal liabilities plus equity?

+
This equality is essential because it represents the accounting equation, which underpins the balance sheet’s structure. It ensures that your business’s financial statements are balanced, indicating accurate financial reporting.
Can Excel help me analyze my balance sheet better?
+
Yes, Excel offers various tools like PivotTables, charts, and conditional formatting that can aid in detailed financial analysis, helping to identify trends, ratios, and potential issues in your balance sheet.
How frequently should I update my balance sheet?

+
For accurate financial tracking, it’s advisable to update your balance sheet at least monthly, although some businesses might benefit from weekly or even daily updates depending on their operations and reporting needs.