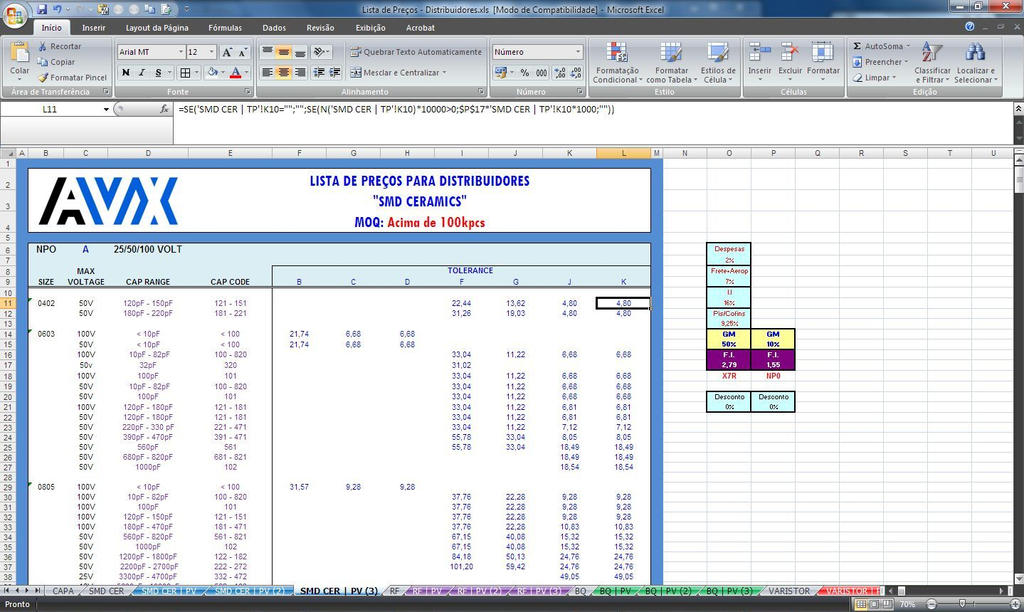
Excel Sheet Design Tips for Better Data Management

In today's data-driven world, Excel remains one of the most powerful and widely used tools for managing, analyzing, and presenting data. Whether you're a business professional, student, or anyone in between, mastering Excel sheet design can significantly enhance your data management capabilities. This blog post dives into the essential tips and tricks for designing Excel sheets that not only look good but also make data handling more efficient.
Why Excel Sheet Design Matters

Good Excel sheet design isn't just about aesthetics; it's about functionality, accuracy, and ease of use:
- Clarity: Well-designed sheets help users to quickly understand and navigate the data.
- Efficiency: Efficient layouts save time by reducing the need for constant scrolling or searching for data.
- Data Integrity: With thoughtful design, you can minimize errors, which is crucial for financial, scientific, or any critical data analysis.
Key Principles of Excel Sheet Design

1. Use Consistent Formatting

Consistency is key to making your data visually accessible:
- Use the same color schemes and font styles for headers, subheaders, and data cells.
- Employ Conditional Formatting to highlight key metrics or trends, which can help in data analysis at a glance.
💡 Note: Avoid using too many colors or styles; simplicity is often more effective in Excel design.
2. Layout and Structure

A well-structured sheet can make complex data more digestible:
| Element | Tip |
|---|---|
| Headers | Place headers at the top, making them distinct with bold text or a different background color. |
| Data Entry Areas | Leave enough space for data input; consider using groups or outlines to expand/collapse sections. |
| Formula Areas | Keep formulas in separate sheets or areas to avoid cluttering the main data presentation. |

Organize your sheet into logical sections using:
- Multiple sheets for different categories of data.
- Named ranges to keep your data and formulas organized.
3. Data Validation

To maintain data integrity:
- Implement Data Validation to restrict data entry to specific types or values.
- Use Drop-down Lists to control input and ensure consistency across datasets.
🔍 Note: Remember to check for duplicates or inconsistencies by using tools like conditional formatting to highlight errors or unique entries.
4. Navigation and Accessibility

Enhance usability with:
- Freeze Panes: Lock headers or important rows/columns for scrolling.
- Table of Contents: If your workbook has multiple sheets, a TOC can help users jump to sections quickly.
5. Automate Where Possible

Automation can reduce manual work and increase accuracy:
- Use Formulas and Functions: Streamline repetitive calculations with functions like VLOOKUP, INDEX-MATCH, or even Pivot Tables for summarizing data.
- Implement Macros: Automate tasks like formatting, data entry, or even simple calculations.
6. Comments and Documentation

Leave notes for future references:
- Add comments to explain complex formulas or highlight specific data points.
- Use Named Ranges: These help with readability, especially in complex spreadsheets.
📝 Note: When using named ranges, make sure to choose descriptive names that reflect their function or purpose within the worksheet.
Putting It All Together

Here’s how you can apply these principles:
- Start with a plan. Sketch out your data structure before diving into Excel.
- Design your spreadsheet with a clear purpose in mind, ensuring every element serves that purpose.
- Test your design with sample data or peers to ensure functionality and user-friendliness.
- Iterate based on feedback. Even the best designs can benefit from real-world use.
By incorporating these design principles, you'll not only make your Excel sheets more visually appealing but also more functional. Remember, the goal is to serve the data, not overshadow it. Proper sheet design can turn complex data sets into actionable insights with ease.
Why is data validation important in Excel sheet design?

+
Data validation ensures data integrity by controlling what can be entered into cells, reducing errors, and maintaining consistency across datasets.
What are some quick wins to improve my Excel sheet’s design?

+
Quick wins include using consistent formatting, employing data validation, and implementing freeze panes to keep important headers in view while scrolling through data.
How can I automate repetitive tasks in Excel?

+
Automation in Excel can be achieved through the use of formulas, functions like VLOOKUP, INDEX-MATCH, or Macros for complex or repetitive tasks.
Can Excel sheets be too colorful or styled?

+
Yes, overuse of colors and styles can distract from the data’s clarity. Use them judiciously to highlight key information without overwhelming the viewer.