Excel Sheet Design Made Easy: Beginner's Guide

Designing an Excel sheet from scratch can seem daunting for beginners. Whether you're organizing personal finances, managing small business inventory, or tracking project timelines, Excel is an incredibly versatile tool. However, knowing how to structure your data, use formulas, and apply formatting can significantly improve your efficiency. This beginner's guide will walk you through the essentials of Excel sheet design, ensuring you can harness the power of spreadsheets with ease.
Understanding Excel Basics

Before you can master Excel, understanding its basic components is crucial:
- Cells: The basic building blocks of any spreadsheet, where data is entered.
- Rows and Columns: Cells are organized into rows (horizontal) and columns (vertical), intersected to form cell references like A1, B2, etc.
- Worksheets: Individual tabs within an Excel workbook where you can organize different sets of data or elements of your project.
- Workbook: A file containing multiple worksheets.

Designing Your Spreadsheet

A well-designed spreadsheet does more than just store data; it makes data analysis intuitive and efficient. Here's how to structure your Excel sheet:
1. Plan Your Layout

Start by outlining what data you need to track and how it relates:
- Decide on the columns you’ll need based on the information you’ll be dealing with regularly.
- Consider the flow of data entry and how you’ll visualize or analyze this data.
2. Use Headers Effectively

The header row in your Excel sheet not only labels your data but also helps in sorting, filtering, and grouping:
- Make Headers Descriptive: Use clear, concise names for columns to avoid confusion.
- Format Headers: Use bold, larger fonts, or different colors to make headers stand out.
3. Implement Proper Data Entry

Maintaining consistency in data entry will make your spreadsheet more usable:
- Date Formats: Decide on a date format and stick to it.
- Text Consistency: Capitalize names and avoid abbreviations unless universally understood.
- Numeric Data: Align numbers to the right in cells for easier reading.
💡 Note: Proper data entry practices reduce errors and make data manipulation easier down the line.
4. Utilize Formulas and Functions

Excel’s power lies in its ability to perform calculations with formulas and functions:
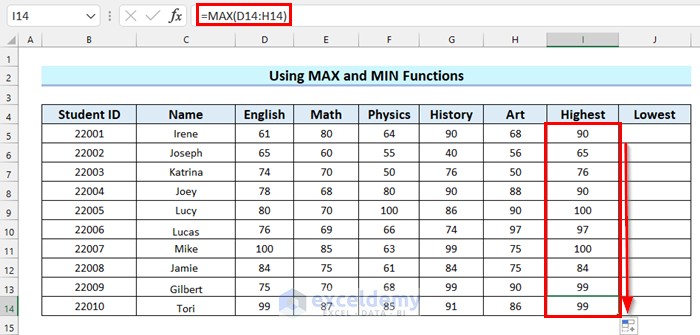
- Common Functions: SUM, AVERAGE, MAX, MIN for basic arithmetic.
- Conditional Functions: IF, VLOOKUP for data analysis.
A simple formula might look like:
=SUM(A1:A10)
🌟 Note: Remember, cell references can be absolute ($A$1), relative (A1), or mixed ($A1 or A$1) based on how the formula should behave when copied.
5. Formatting for Clarity

Using Excel’s formatting tools enhances readability:
- Apply conditional formatting for visual data cues.
- Use borders to define areas or sections of your sheet.
- Color-code cells or rows to indicate categories or status.
| Action | Excel Shortcut | Function |
|---|---|---|
| Copy | Ctrl + C | Copy cell content |
| Paste | Ctrl + V | Paste cell content |
| Format Cells | Ctrl + 1 | Open format cells dialogue |

6. Charts and Visualization

Visual representation of data can be crucial for presentations or understanding trends:
- Pie Charts: Ideal for showing proportions.
- Line Charts: Great for displaying changes over time.
- Bar or Column Charts: Useful for comparing values across categories.
Advanced Tips for Excel Efficiency

Beyond the basics, mastering some advanced techniques can streamline your Excel work:
- Data Validation: Limit what users can enter into cells to ensure data integrity.
- Conditional Formatting: Automatically highlight cells based on certain conditions for quick analysis.
- Named Ranges: Use names to refer to specific areas of your sheet, making formulas easier to read and update.
- Tables: Convert your data range into a table for dynamic data handling and filtering.
📝 Note: These features not only enhance the functionality of your spreadsheet but also make it more intuitive to use.
In the end, designing an Excel sheet involves a balance of functionality, readability, and data management. Start with clear planning, use headers effectively, maintain data entry consistency, leverage Excel’s formula capabilities, and apply formatting for clarity. Remember, the goal is not just to create a sheet but to make one that is effective, efficient, and easy to use for yourself and potentially for others. Keeping up with Excel’s evolving features and practicing regularly can turn you from a beginner into a proficient user, unlocking even more potential for productivity and analysis.
What are the most important Excel functions for beginners to learn?

+
Start with basic arithmetic functions like SUM, AVERAGE, MAX, MIN. Conditional logic functions like IF, AND, OR, and lookup functions like VLOOKUP or HLOOKUP are also crucial for basic data manipulation.
How can I prevent errors in my Excel sheets?

+
Use data validation to restrict inputs, apply consistent data entry rules, and regularly check your formulas for errors. Also, consider protecting important cells or entire sheets to prevent accidental changes.
Can Excel be used for project management?

+
Absolutely! With features like Gantt charts (created using stacked bar charts), you can track project timelines. You can also set up task lists, assignees, due dates, and use conditional formatting to highlight delays or completed tasks.
What is the difference between a formula and a function in Excel?

+
A formula is an expression you manually create using cell references and operators, e.g., =A1+A2. A function, on the other hand, is a predefined formula that performs calculations using specific values, in a particular order, e.g., =SUM(A1:A10).