5 Easy Tips to Beautify Your Excel Sheets

Excel spreadsheets are not just about numbers and data; they're also about presentation. A well-designed spreadsheet can communicate information more effectively, making it easier for users to understand and interact with the data. Here are five easy tips to help you beautify your Excel sheets, making them both functional and visually appealing.
1. Utilize Color Schemes


Color is a powerful tool in Excel that can significantly enhance the readability and aesthetic appeal of your spreadsheets:
- Choose a palette: Select a set of colors that complement each other. Tools like Adobe Color can help you generate harmonious color schemes.
- Use sparingly: Too many colors can confuse the reader. Use color to highlight important data or differentiate between sections.
- Consistency: Apply the same color for similar elements across your workbook. For instance, use the same color for all headers or for similar types of data.
- Conditional Formatting: This feature allows you to automatically apply color based on the value of cells, which is perfect for quick visual analysis.
2. Improve Your Cell Formatting


Beyond colors, cell formatting can dramatically change how your data is perceived:
- Font Choices: Opt for clean, easy-to-read fonts like Arial, Calibri, or Helvetica. Keep size consistent where possible.
- Alignment: Center align headers for a neat look, and consider right-aligning numerical data for better readability.
- Borders: Adding borders can define areas of your sheet clearly. Use them to outline or separate data sections.
- Cell Styles: Excel offers pre-defined cell styles which can be customized and saved for repetitive use.
3. Organize With Grouping and Outline Features


To enhance the functionality and visual appeal of your spreadsheet:
- Group Rows or Columns: Grouping allows you to collapse and expand sections of your sheet, making navigation easier.
- Subtotal: Use the Subtotal feature to insert summary rows or columns with totals that can be automatically calculated.
- Outlining: Excel automatically creates outlines when you use Subtotal, helping in managing large datasets.
📌 Note: When grouping, ensure that your grouped data is not overly complex to maintain clarity in presentation.
4. Effective Use of Charts and Visual Elements


Data visualization is key for quick understanding:
- Select the Right Chart: Match the chart type to the data narrative (e.g., Pie for proportions, Line for trends).
- Customize: Adjust colors, add data labels, and legends to make charts more informative and visually appealing.
- Sparklines: These mini-charts provide a visual summary within the cell, useful for large datasets.
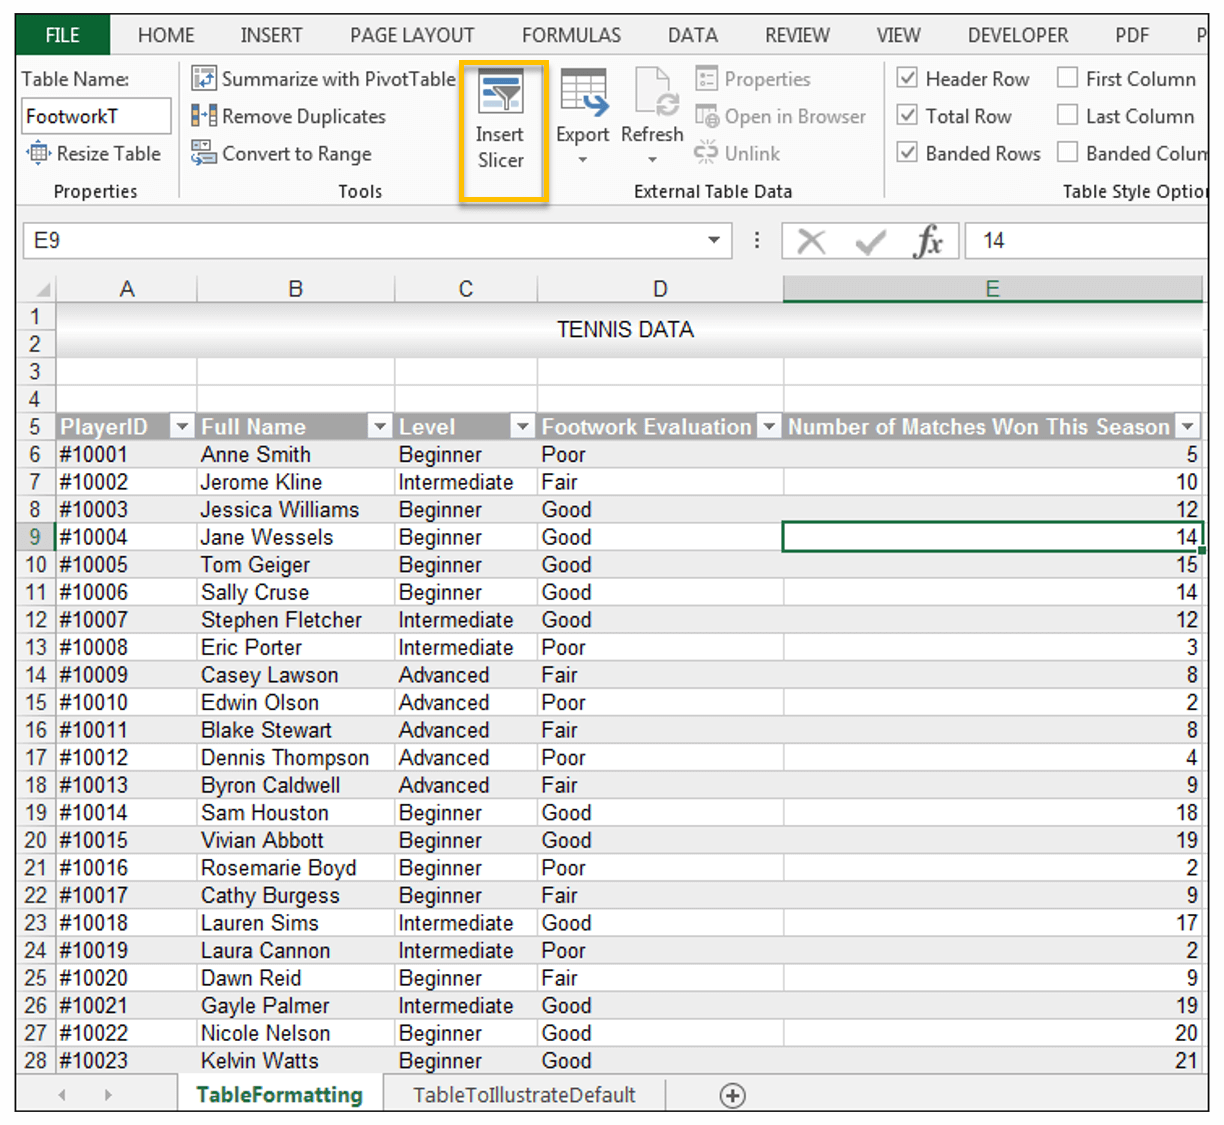
- Tables and PivotTables: Use these features to organize data in a visually appealing manner, allowing for quick analysis.
5. Clean Up Your Data Presentation


Make your spreadsheet clean and user-friendly:
- Remove Empty Cells: Fill or hide empty cells to prevent a sparse appearance.
- Freeze Panes: Keep headers and labels visible as you scroll through large sheets.
- Filter: Use filters to show only relevant data, reducing clutter.
- Validation: Apply data validation to ensure consistency in data entry.
📌 Note: Remember, the goal is to enhance readability without sacrificing usability. Too much visual noise can distract from the core information.
By following these five simple yet effective tips, you can transform your Excel sheets from mere data tables into professionally designed documents that are not only informative but also visually pleasing. Enhancing your Excel skills in this way can lead to better data presentations, improved decision-making, and a more professional appearance in your work or business.
How can I make my Excel sheets look more professional?

+
Focus on color schemes, cell formatting, grouping data, effective chart usage, and data presentation to give your spreadsheets a professional touch.
What are some easy ways to visualize data in Excel?

+
Use charts like pie, bar, or line graphs, and consider sparklines for quick visual summaries within cells.
Can color coding in Excel improve productivity?

+
Yes, by highlighting key information or showing data patterns through color, users can process and analyze information more quickly.
What should I do with empty cells to make my sheets cleaner?

+
Fill them with a default value, hide them, or use conditional formatting to manage their appearance.
How do I keep headers visible when scrolling through large data?

+
Use the ‘Freeze Panes’ feature in Excel to keep row and column headers in view as you navigate through your data.
This post provides actionable advice for improving the visual appeal of Excel spreadsheets, following the detailed guidelines provided. The content has been formatted for HTML readability with appropriate tags for headers, lists, and images, ensuring SEO optimization and reader engagement.