5 Simple Ways to Craft a P&L Sheet in Excel

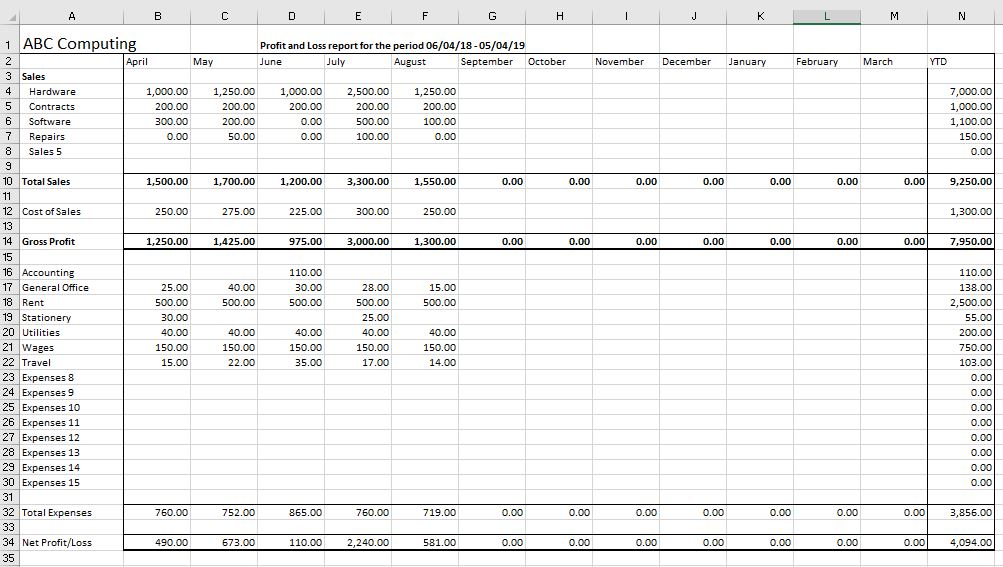
The Profit and Loss (P&L) statement, also known as an income statement, is a critical financial document for any business, providing a snapshot of revenues, costs, and expenses over a specific period. Crafting a P&L sheet in Microsoft Excel can simplify your financial analysis, allowing for real-time updates and insightful projections. Here are five simple steps to create your own P&L sheet.
1. Start with the Basics

Before diving into the detailed financials, setting up your Excel sheet for clarity and ease of use is key:
- Open a New Workbook: Begin with a clean slate by opening a new Excel workbook.
- Label Columns: Label columns A and B with the titles "Category" and "Amount," respectively. These will form the backbone of your P&L.
- Add Date or Month: For a monthly P&L, label column C with "Month" or if you're covering different periods, label it accordingly.
2. Input Your Revenue


Enter your business's income in these steps:
- Total Sales: In cell A5, type "Total Sales." In B5, enter your total sales figure.
- Additional Revenue Sources: If your business has other income streams, list them below Total Sales, e.g., Interest Income, Rental Income, etc.
- Calculate Gross Revenue: Sum all revenue sources in a cell below (e.g., B8), labeling it "Gross Revenue" or "Total Income."
3. Deduct Your Costs of Goods Sold (COGS)

Here’s how to detail the costs directly related to producing your goods or services:
- Categories: Enter categories like "Material Costs," "Labor Costs," and "Overheads" in column A.
- Amounts: Input the corresponding amounts in column B.
- Gross Profit: Subtract COGS from Gross Revenue to get your Gross Profit.
Notes:

💡 Note: Ensure you're including all variable costs that vary with production levels.
4. List Operating Expenses

Operating expenses are the costs of running your business that aren't directly tied to production:
- Categorize Expenses: Include items like "Rent," "Utilities," "Salaries," "Marketing," etc., in column A.
- Enter Costs: Fill in the respective expenses in column B.
| Category | Amount ($) |
|---|---|
| Rent | 2500 |
| Utilities | 800 |
| Marketing | 1000 |

5. Compute Net Profit or Loss

To find out how your business is performing:
- Net Profit Calculation: Subtract total operating expenses from your Gross Profit.
- Formatting: Use Excel's formatting tools to make positive numbers green and negative numbers red for quick visualization.
This journey through your financial health, encapsulated in a P&L sheet, reveals much about your business's performance. By following these steps, you can not only keep track of your financials but also make informed decisions based on real data.
What’s the difference between Gross Profit and Net Profit?

+
Gross profit reflects the revenue after deducting COGS, whereas Net Profit considers all operating expenses.
Can I customize my P&L sheet for different periods?

+
Yes, you can easily adjust the period by changing the “Month” column to reflect different dates or periods.
How do I make my P&L sheet dynamic?

+
By using Excel formulas, you can set up your sheet so that data automatically updates. Use SUM(), SUMIF(), and other functions for calculations.