Creating Excel Spreadsheets: Easy Worksheet and Balance Guide

Introduction to Excel Spreadsheets

Microsoft Excel is a powerful tool used by millions of professionals, students, and hobbyists for various purposes ranging from simple data entry to complex financial modeling. Excel spreadsheets are particularly invaluable when it comes to organizing, analyzing, and managing data efficiently. In this guide, we'll delve into creating easy-to-use worksheets and balance guides using Excel, offering you practical steps to harness the full potential of this software.
Setting Up Your Excel Environment

Before you start creating spreadsheets, ensure your Excel environment is set up correctly for optimal productivity:
- Adjust Display Settings: Set the zoom level to 100% for standard spreadsheet readability. Adjust row heights and column widths to fit your content.
- Customize the Ribbon: Organize the Excel Ribbon to show the most-used tools for your tasks.
- Save Time with AutoSave: Enable AutoSave to prevent data loss due to unexpected crashes.
- Familiarize with Shortcuts: Learn common Excel keyboard shortcuts to speed up your workflow.
Creating Your First Spreadsheet

Creating a spreadsheet in Excel involves several key steps:
1. Starting a New Workbook

- Launch Excel and choose to open a new workbook or select a template if you prefer a pre-formatted structure.
2. Organizing Data

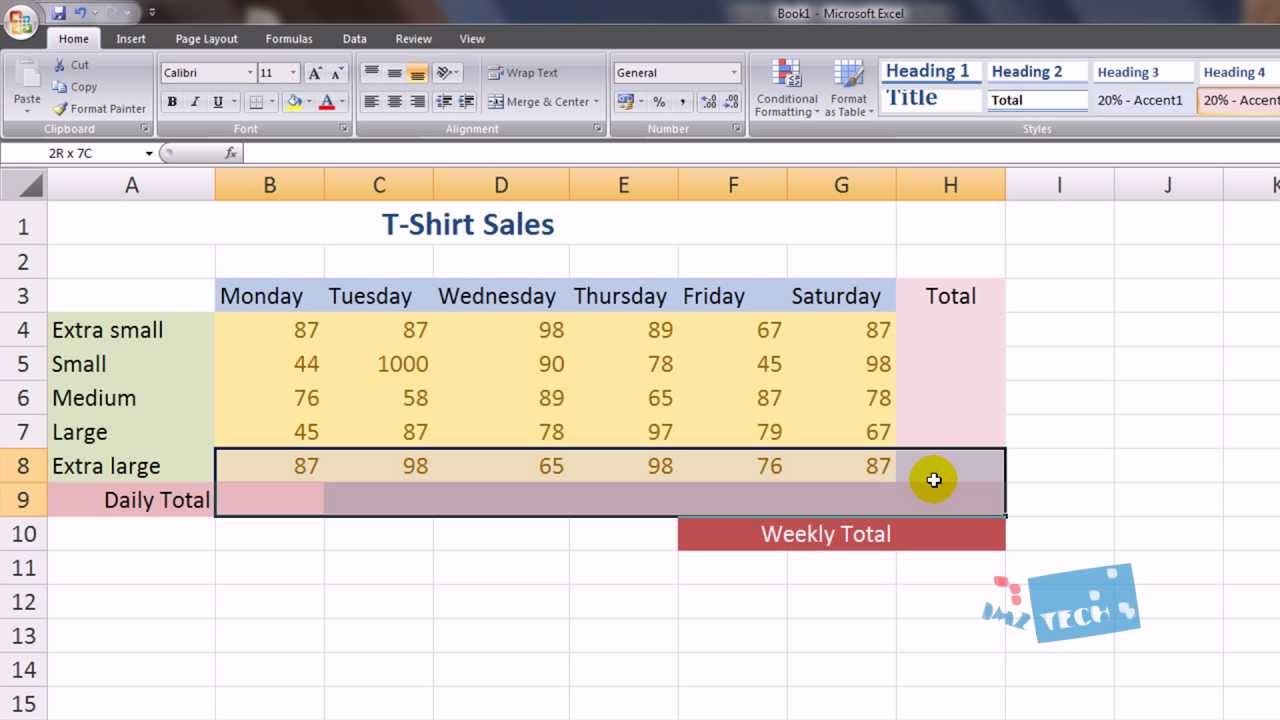
- Use Headers: Clearly label your columns and rows to describe what each contains. For example, if you’re creating a balance guide, headers might include “Date,” “Transaction,” “Income,” and “Expense.”
- Inputting Data: Enter your data systematically. Ensure consistency in data entry (e.g., date format, currency, etc.)
3. Formatting the Spreadsheet

- Apply cell styles, color coding, or conditional formatting to highlight important data or make your spreadsheet visually appealing.
Advanced Techniques for Worksheet Management

Here are some advanced techniques to manage your Excel worksheets effectively:
1. Cell References and Formulas

- Use formulas to perform calculations. For instance, if you’re tracking income and expenses, you can use:
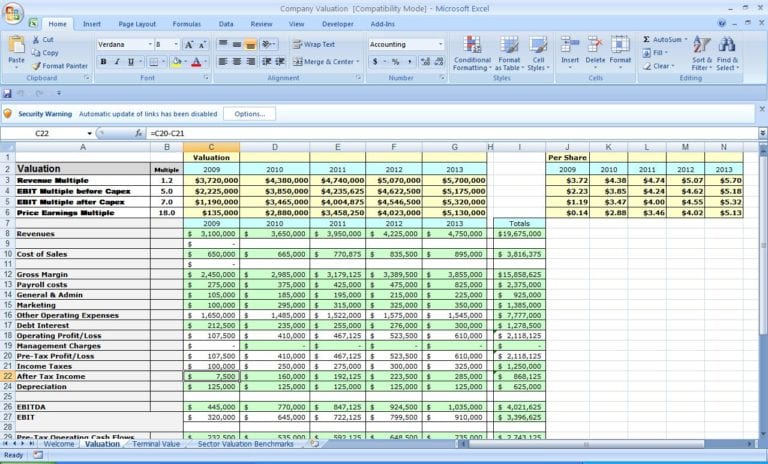
Formula Description =SUM(C2:C10) Sums up values from cells C2 to C10 =IF(A2>B2, “Profit”, “Loss”) Checks if value in A2 is greater than B2 
2. Data Validation

- Use data validation rules to ensure users enter the correct type or range of data. For instance, restricting entries in a “Date” column to only dates.
3. Conditional Formatting

- Automatically format cells based on their content or the content of other cells. This can visually guide users through data anomalies or trends.
4. Pivot Tables

- Pivot tables allow you to summarize and analyze large datasets, making it easier to draw insights without altering the source data.
Creating a Balance Guide

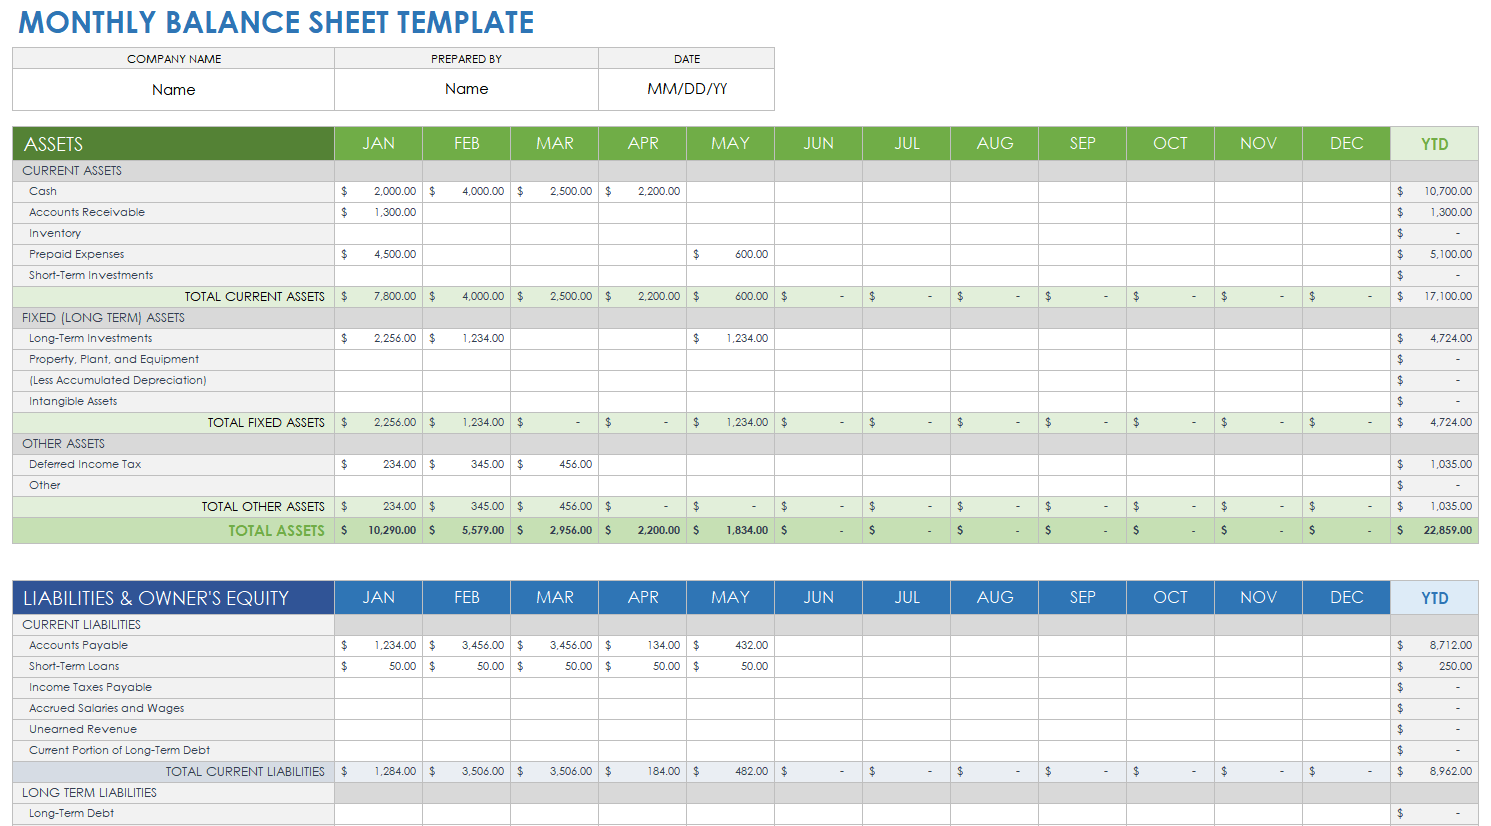
A balance guide in Excel is often used to track financial inflows and outflows. Here's how you can set it up:
1. Define Categories

- Identify the main categories for your financial transactions, such as “Salary,” “Rent,” “Utilities,” “Food,” and “Entertainment.”
2. Layout Your Spreadsheet

- Structure your worksheet to have columns for Date, Description, Category, Amount (either income or expense), and a Running Total.
3. Implement Formulas

- Use formulas to calculate the running balance. For instance, if you have income and expenses in columns D and E:
🔍 Note: Ensure the formula captures the net effect on the balance correctly.
Data Visualization

Excel excels (pun intended) in data visualization. Here’s how you can enhance your spreadsheets:
1. Charts and Graphs
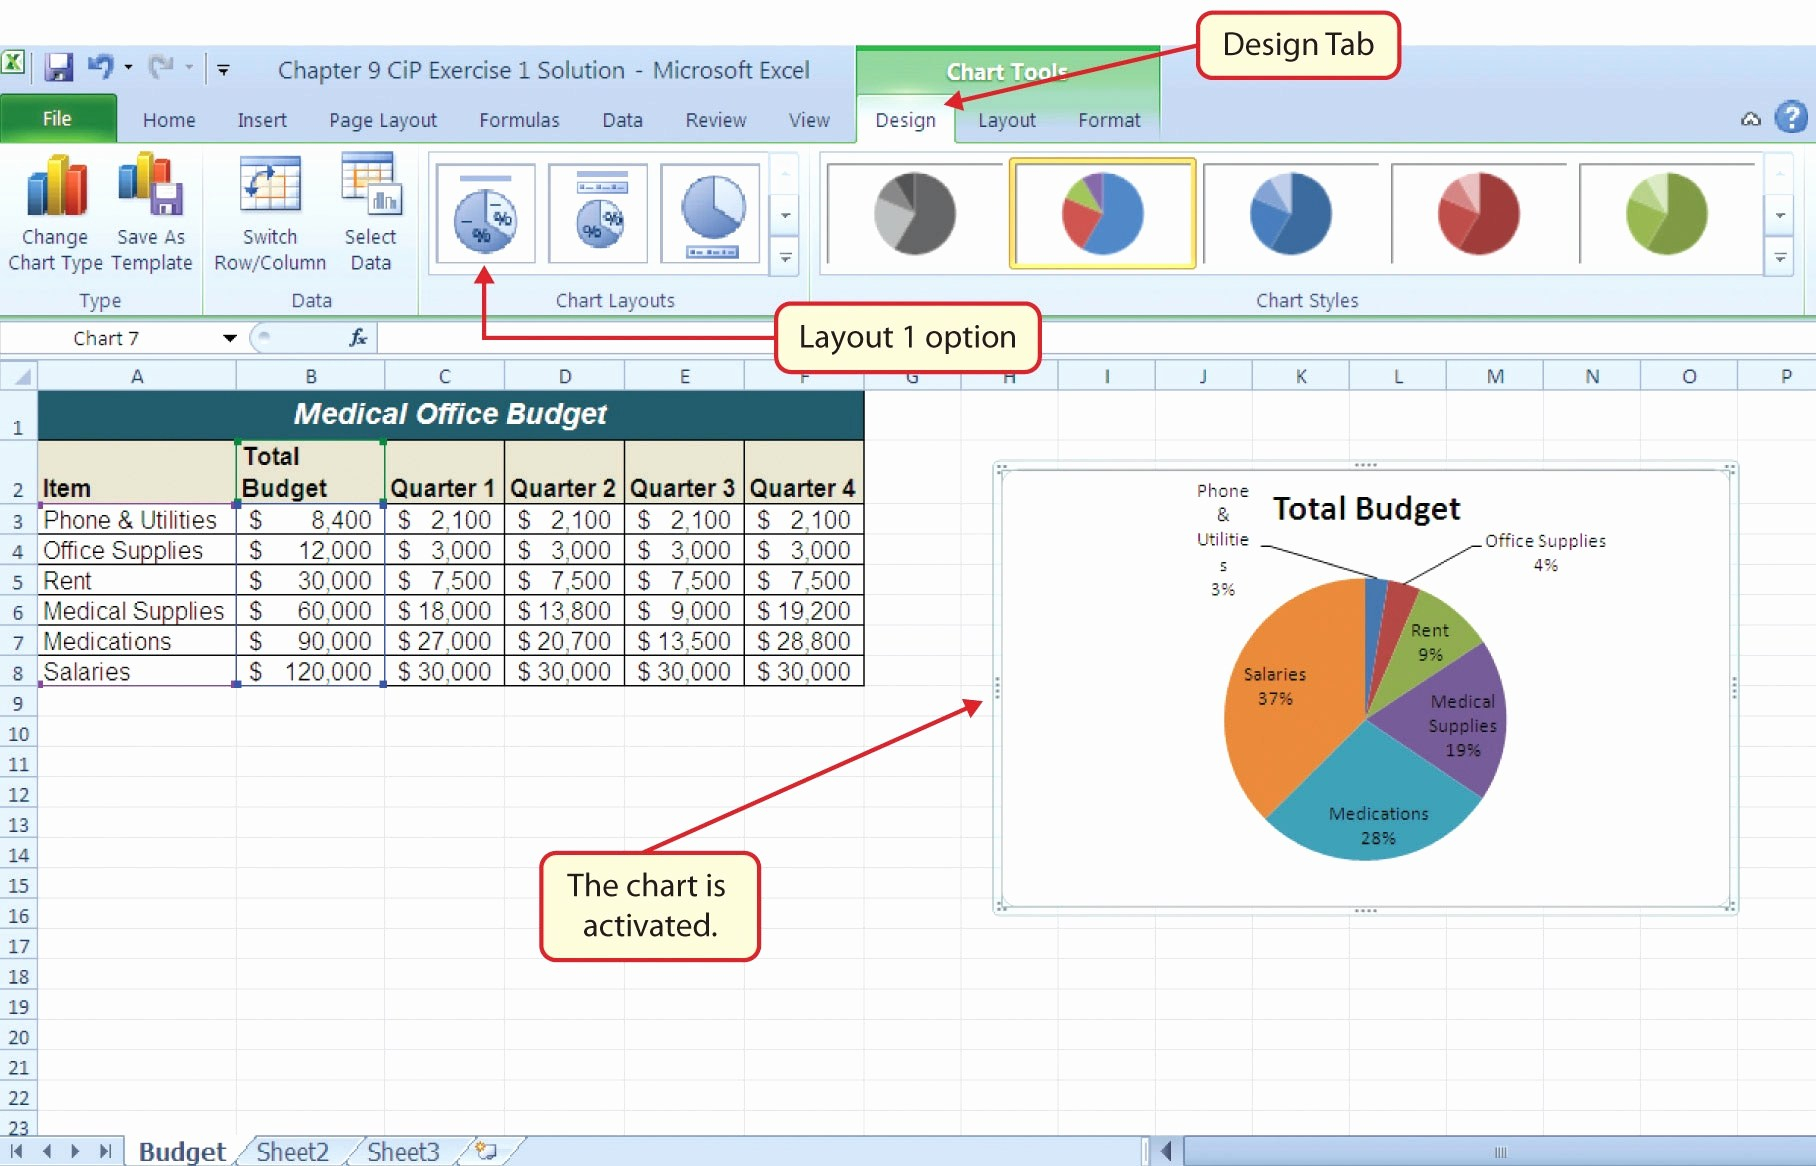
- Create charts like line graphs for trend analysis, pie charts for proportions, or bar charts for comparisons.
2. Sparklines
- Use sparklines within cells to show mini-graphs of data trends without taking up much space.
Sharing and Collaboration

Excel offers robust collaboration tools:
1. Sharing Workbooks
- Enable workbook sharing to allow multiple users to edit the spreadsheet simultaneously. Use “Review” -> “Share Workbook” for this feature.
2. Version Control
- Use the “Track Changes” feature to monitor modifications made by collaborators, offering a layer of accountability and control.
This blog post has covered the essentials of setting up and managing Excel spreadsheets with a focus on creating easy worksheets and balance guides. From initial setup to advanced management techniques, the goal has been to provide a comprehensive guide that not only makes Excel more approachable but also boosts productivity. Whether you're tracking personal finances, managing project data, or analyzing business metrics, Excel provides tools to streamline these processes. Remember, mastering Excel takes practice, but with the tips provided here, you're on your way to becoming more proficient. Keep exploring Excel's features, and don't shy away from experimenting with different ways to present and analyze your data.
What are the benefits of using Excel for personal budgeting?
+Excel allows for real-time tracking of income and expenses, customizable categories, and the ability to perform quick calculations and forecasts. It’s highly flexible, making it suitable for both simple and complex budgeting needs.
How do I ensure data security when sharing Excel files?
+You can use password protection to secure your Excel file. Go to “File” -> “Info” -> “Protect Workbook” and set a password. Also, consider using OneDrive or SharePoint for controlled access and versioning.
Can Excel handle large datasets?
+Yes, Excel can manage large datasets, but performance might slow down with very large files. Use features like “Data Model” for better handling of big data, or consider using Power BI for more advanced analytics.