5 Ways to Create Excel Answer Report Sheets Fast

In today's business world, the ability to efficiently analyze and report data is crucial for success. Whether you're a project manager tracking team performance or an analyst presenting insights to stakeholders, generating a clear and concise Excel answer report can be time-consuming if not approached correctly. Here are five innovative ways to create Excel answer report sheets quickly, ensuring that you can present your data effectively without spending hours on formatting and calculations.
1. Utilize PivotTables for Dynamic Reporting

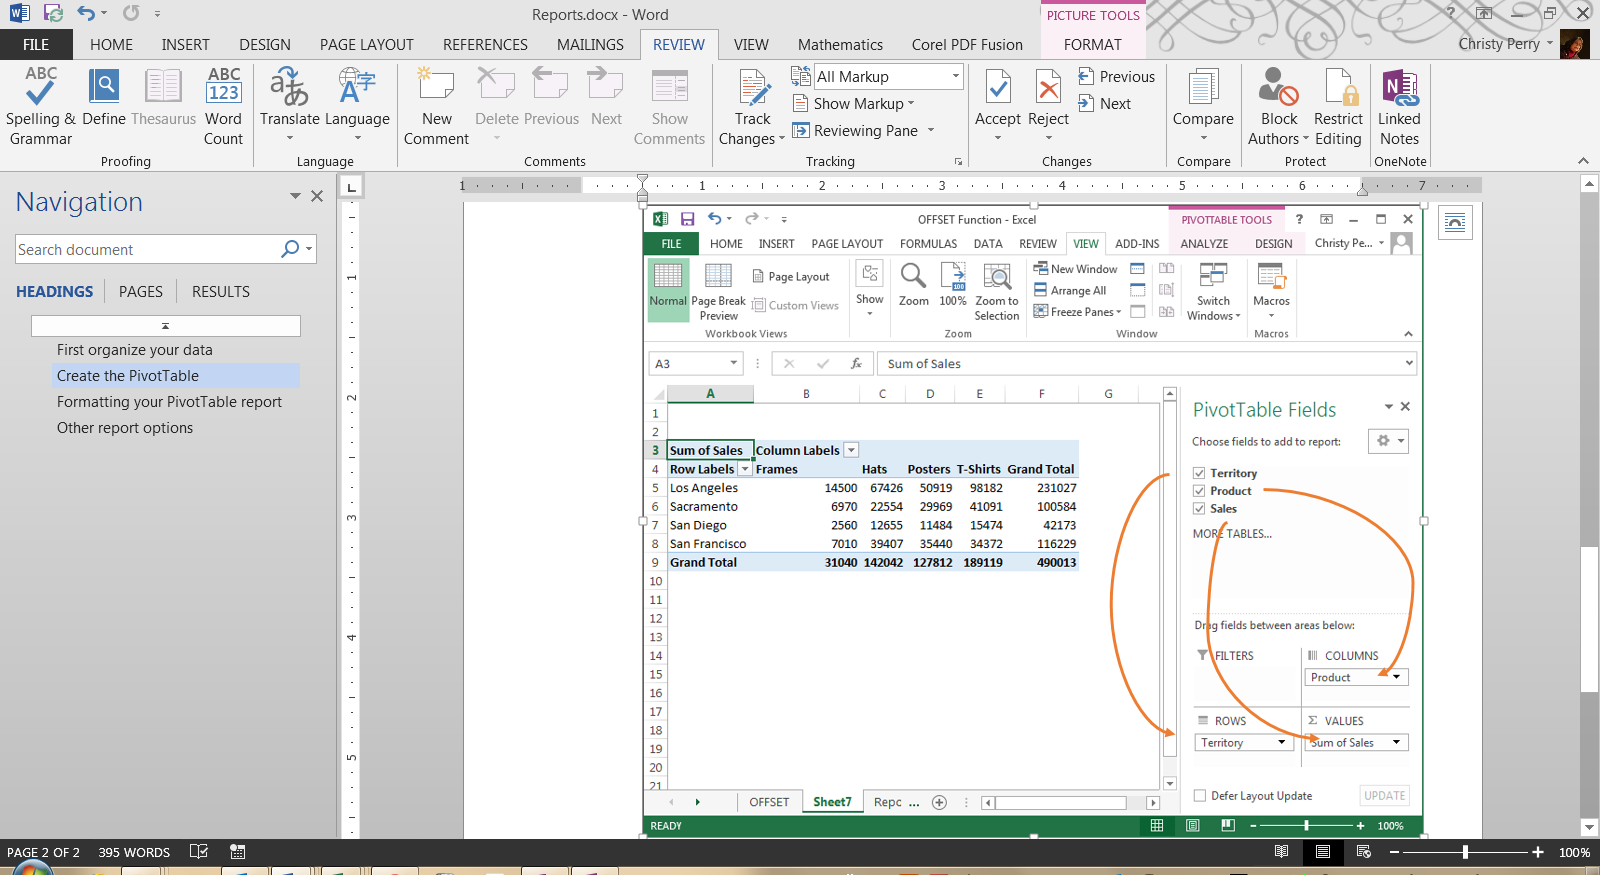
PivotTables in Excel are powerful tools that can help you summarize, analyze, explore, and present your data. Here’s how you can use them for creating report sheets:
- Preparation: Ensure your data is clean and structured with headers.
- Create a PivotTable: Select your data range and go to Insert > PivotTable.
- Drag Fields: Drag relevant fields into rows, columns, values, or filters to create your report structure.
- Customize: Use the PivotTable Field List to organize your data as needed. You can also refresh data for up-to-date reports.
- Formatting: Apply number formatting, conditional formatting, and design options from the PivotTable Tools tabs to make your report visually appealing.
💡 Note: PivotTables update dynamically, ensuring your reports reflect the latest data with minimal manual intervention.
2. Employ Excel Formulas for Automated Calculations

To speed up the process of creating an answer report, you can use Excel formulas for automated calculations:
- Use Functions: Functions like SUMIF, VLOOKUP, INDEX/MATCH, and AVERAGEIF can perform calculations based on conditions or references.
- Formula Array: For complex calculations, use array formulas (e.g., CTRL + SHIFT + ENTER) to return multiple results or perform operations across datasets.
- Create Dynamic Named Ranges: Dynamic named ranges adjust as your data grows, automatically updating your calculations.
- Templates: Save templates with pre-set formulas to apply to similar datasets for consistent reporting.
3. Leverage VBA Macros for Repetitive Tasks

Visual Basic for Applications (VBA) can automate repetitive tasks, allowing you to create report sheets with just a click:
- Record a Macro: Record a simple action sequence (like formatting, data entry, etc.) and use it to automate similar tasks.
- Custom Macros: Write custom VBA code to automate complex sequences of actions, from data imports to report generation.
- Error Handling: Implement error handling in your macros to ensure reliability.
- Distribute Macros: Share or distribute your macros by including them in workbook templates for easy use by colleagues.
4. Implement Data Validation for Data Integrity

To ensure the accuracy and consistency of data input, which is crucial for reliable reports, use Excel’s data validation:
- Validation Rules: Set rules for inputs (e.g., numbers only, date range, list-based options) to prevent erroneous data entry.
- Dropdown Lists: Create dropdown lists to standardize responses or selections.
- Custom Messages: Customize error alerts to guide users on how to correct data entry mistakes.
- Formatting: Use conditional formatting linked to validation to visually cue users when data isn’t valid.
📍 Note: Data validation significantly reduces the need for data cleaning before analysis, saving time in report creation.
5. Use Power Query for Data Transformation

Power Query, now integrated into Excel, can automate the process of transforming and cleaning data before reporting:
- Import and Clean Data: Power Query can connect to various data sources and transform data through steps like filtering, merging, splitting, and pivoting.
- Refreshable Data Connections: Set up connections that automatically refresh, ensuring your report always uses the latest data.
- Automate Load: Schedule the loading of data into your Excel sheet for immediate reporting.
- Version Control: With Power Query, you can version control your data transformation steps for consistency.
In wrapping up this guide on expediting the creation of Excel answer report sheets, it’s important to highlight that mastering these methods can streamline your workflow considerably. By leveraging PivotTables, automating calculations with formulas, creating macros, implementing data validation, and using Power Query, you can transform hours of work into minutes. Remember, the key to success is not just knowing these tools but also understanding when and how to apply them effectively in your specific reporting tasks.
How do PivotTables help in report creation?

+
PivotTables allow you to analyze and summarize data dynamically. By dragging and dropping fields into rows, columns, and values, you can quickly pivot your data to see different summaries, identify trends, and make complex data manageable for reporting.
What are the benefits of using macros in Excel for reports?

+
Macros automate repetitive tasks, reducing human error, saving time, and ensuring consistency. They can format data, update calculations, and generate reports with a single click, making reporting faster and more efficient.
Can Excel’s Power Query handle multiple data sources?

+
Yes, Power Query can connect to various data sources including databases, web pages, CSV files, and more. This flexibility allows you to merge and transform data from different sources into a cohesive report in Excel.