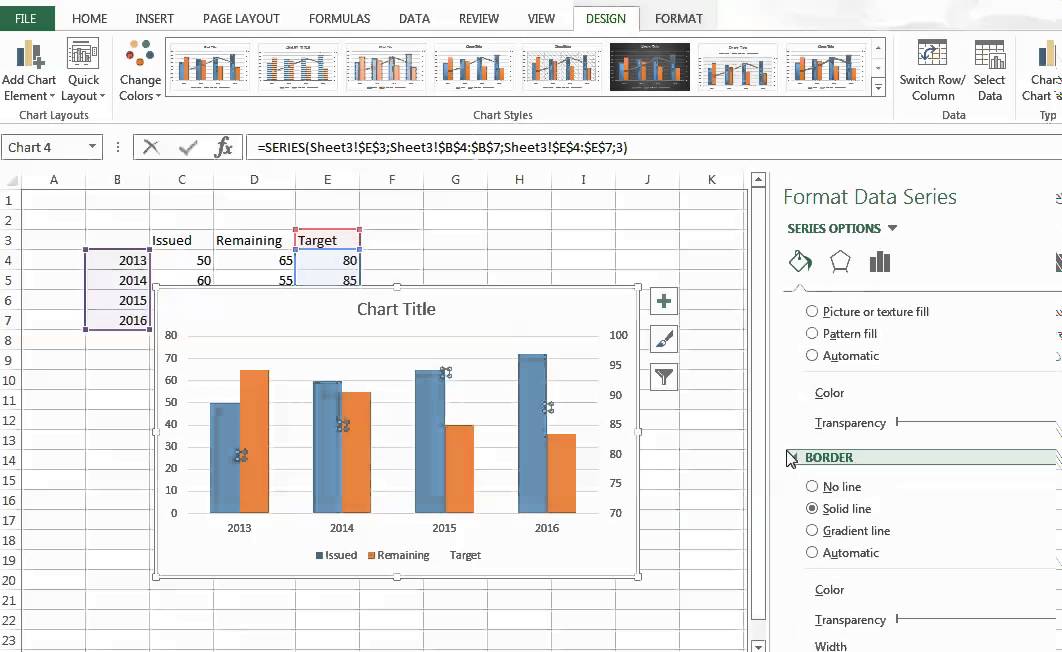
3 Ways to Merge Excel Sheets for Graph Creation

Merging multiple Excel sheets for graph creation can significantly streamline your data analysis process, allowing you to synthesize information from various sources into one cohesive visual representation. Whether you're compiling financial data, tracking project progress, or analyzing research outcomes, merging sheets can save time and enhance the accuracy of your analysis. Here are three effective methods to merge Excel sheets for creating graphs:
Method 1: Using Power Query

Power Query is an excellent tool for data transformation in Excel, allowing you to combine and shape data from multiple sheets or files.
- Open Excel and go to the Data tab to access the Get & Transform Data group.
- Select New Query > From File > From Workbook to browse and select the Excel file containing your data.
- Choose the workbooks or sheets you want to merge from the Navigator window. You can append or merge these sheets:
- For Append, select one sheet, click on Append Queries, and then choose the next sheet. This is useful when each sheet contains similar data structures.
- For Merge, select one as the primary table and add columns from other sheets using a common key, like an ID field, to join them.
- After merging, load the transformed data into a new worksheet or to an existing table with Close & Load.
⚠️ Note: Power Query requires at least Microsoft 365 or Excel 2016 to function.
Method 2: Consolidate Function

If you have sheets within the same workbook or multiple workbooks in one folder, Excel’s Consolidate function can be your go-to method:
- Select the cell where you want the result to appear.
- Go to the Data tab, click Consolidate under the Data Tools group.
- Choose your function (Sum, Average, etc.) and specify the ranges from each sheet you wish to combine.
- Select Create links to source data if you want changes in source sheets to automatically update the consolidated data.
This method is particularly useful when you need a quick summary or when you frequently update your source data.
💡 Note: Remember that the Consolidate feature in Excel does not support dynamic linking by default; changes in source sheets need manual consolidation again unless you enable this option.
Method 3: Using VBA Macro

For those familiar with VBA (Visual Basic for Applications), writing a macro to merge sheets can automate repetitive tasks:
- Open the Visual Basic Editor (Alt + F11).
- Insert a new module (Insert > Module).
- Write or paste the following sample macro:
Sub MergeSheets()
    Dim wsSource As Worksheet, wsDest As Worksheet
    Dim lrSource As Long, lrDest As Long
    Dim i As Integer

    ' Define the destination sheet
    Set wsDest = ThisWorkbook.Worksheets("MergedSheet")

    ' Clear destination sheet content except for headers
    lrDest = wsDest.Cells(wsDest.Rows.Count, 1).End(xlUp).Row
    wsDest.Rows("2:" & lrDest).ClearContents

    ' Loop through all source sheets
    For i = 1 To ThisWorkbook.Worksheets.Count
        If ThisWorkbook.Worksheets(i).Name <> wsDest.Name Then
            Set wsSource = ThisWorkbook.Worksheets(i)
            lrSource = wsSource.Cells(wsSource.Rows.Count, 1).End(xlUp).Row

            ' Append source data to destination sheet
            wsSource.Rows("2:" & lrSource).Copy
            lrDest = wsDest.Cells(wsDest.Rows.Count, 1).End(xlUp).Row + 1
            wsDest.Cells(lrDest, 1).Select
            wsDest.Paste
        End If
    Next i
End Sub
- Execute the macro to merge data from all sheets into a specified sheet.
💻 Note: Ensure your macro security settings allow macros to run, as this can pose a security risk if not managed properly.
After successfully merging your data, creating graphs becomes straightforward. With a single dataset in one sheet, you can select the merged data, go to the Insert tab, and choose the type of graph you need. Whether it's a line chart, bar chart, or scatter plot, Excel provides various options to visualize your data effectively.
Remember that merging sheets can sometimes result in formatting inconsistencies or data duplication, so ensure your data is consistent before merging. Here are some tips to keep in mind:
- Ensure data is formatted similarly across sheets (e.g., same headers, consistent data types).
- Check for and remove any duplicate entries after merging.
- Consider the size of your dataset; large datasets might require optimization for performance.
📊 Note: For large datasets, consider using external tools like Power BI for more advanced data merging and visualization capabilities.
In summary, merging Excel sheets for graph creation is an essential skill for data analysis. Whether using Power Query for robust data transformation, the Consolidate function for quick summaries, or a VBA macro for automation, each method has its strengths. By understanding these approaches, you can choose the best tool for your specific needs, improving efficiency and accuracy in your data visualization tasks.
What are the main advantages of merging Excel sheets for graph creation?

+
Merging Excel sheets allows you to consolidate data from multiple sources, providing a comprehensive view that facilitates better analysis and reporting. It saves time, reduces errors by limiting manual data entry, and enables you to visualize trends or patterns across different datasets in one graph.
How do I decide which merging method to use?

+
Your choice depends on your data’s complexity, the size of the dataset, the need for automation, and your familiarity with Excel tools. Power Query is ideal for complex data transformation, Consolidate for quick summaries, and VBA for repetitive tasks.
Can merging sheets affect data integrity?

+
Yes, merging can potentially introduce errors if not done carefully. Ensure data consistency before merging, look out for duplicates, and maintain source data integrity to avoid conflicts or data loss during the merge.