5 Ways to Compare Numbers in Excel Sheets

In the realm of data analysis, Excel sheets stand as a cornerstone tool for professionals across numerous industries. Excel's robust capabilities allow for efficient organization, manipulation, and analysis of numerical data. A crucial part of data handling in Excel involves comparing numbers to identify trends, make decisions, and extract insights. Here are five effective methods to compare numbers in Excel sheets, each tailored to meet different analytical needs:
1. Conditional Formatting

Conditional Formatting in Excel provides a visual means to compare numbers:
- Data Bars: These are graphical bars within cells that visually represent the value of a cell relative to other cells in the selected range.
- Color Scales: You can apply two- or three-color gradients to highlight values that are less than, equal to, or greater than others.
- Icon Sets: Use arrows or traffic lights to indicate relative changes or performance metrics.

To apply Conditional Formatting:
- Select the cells to format.
- Go to the Home tab, click on Conditional Formatting, and choose your formatting rule.
- Configure the rules according to your data comparison needs.
2. Using VLOOKUP or INDEX/MATCH for Comparison

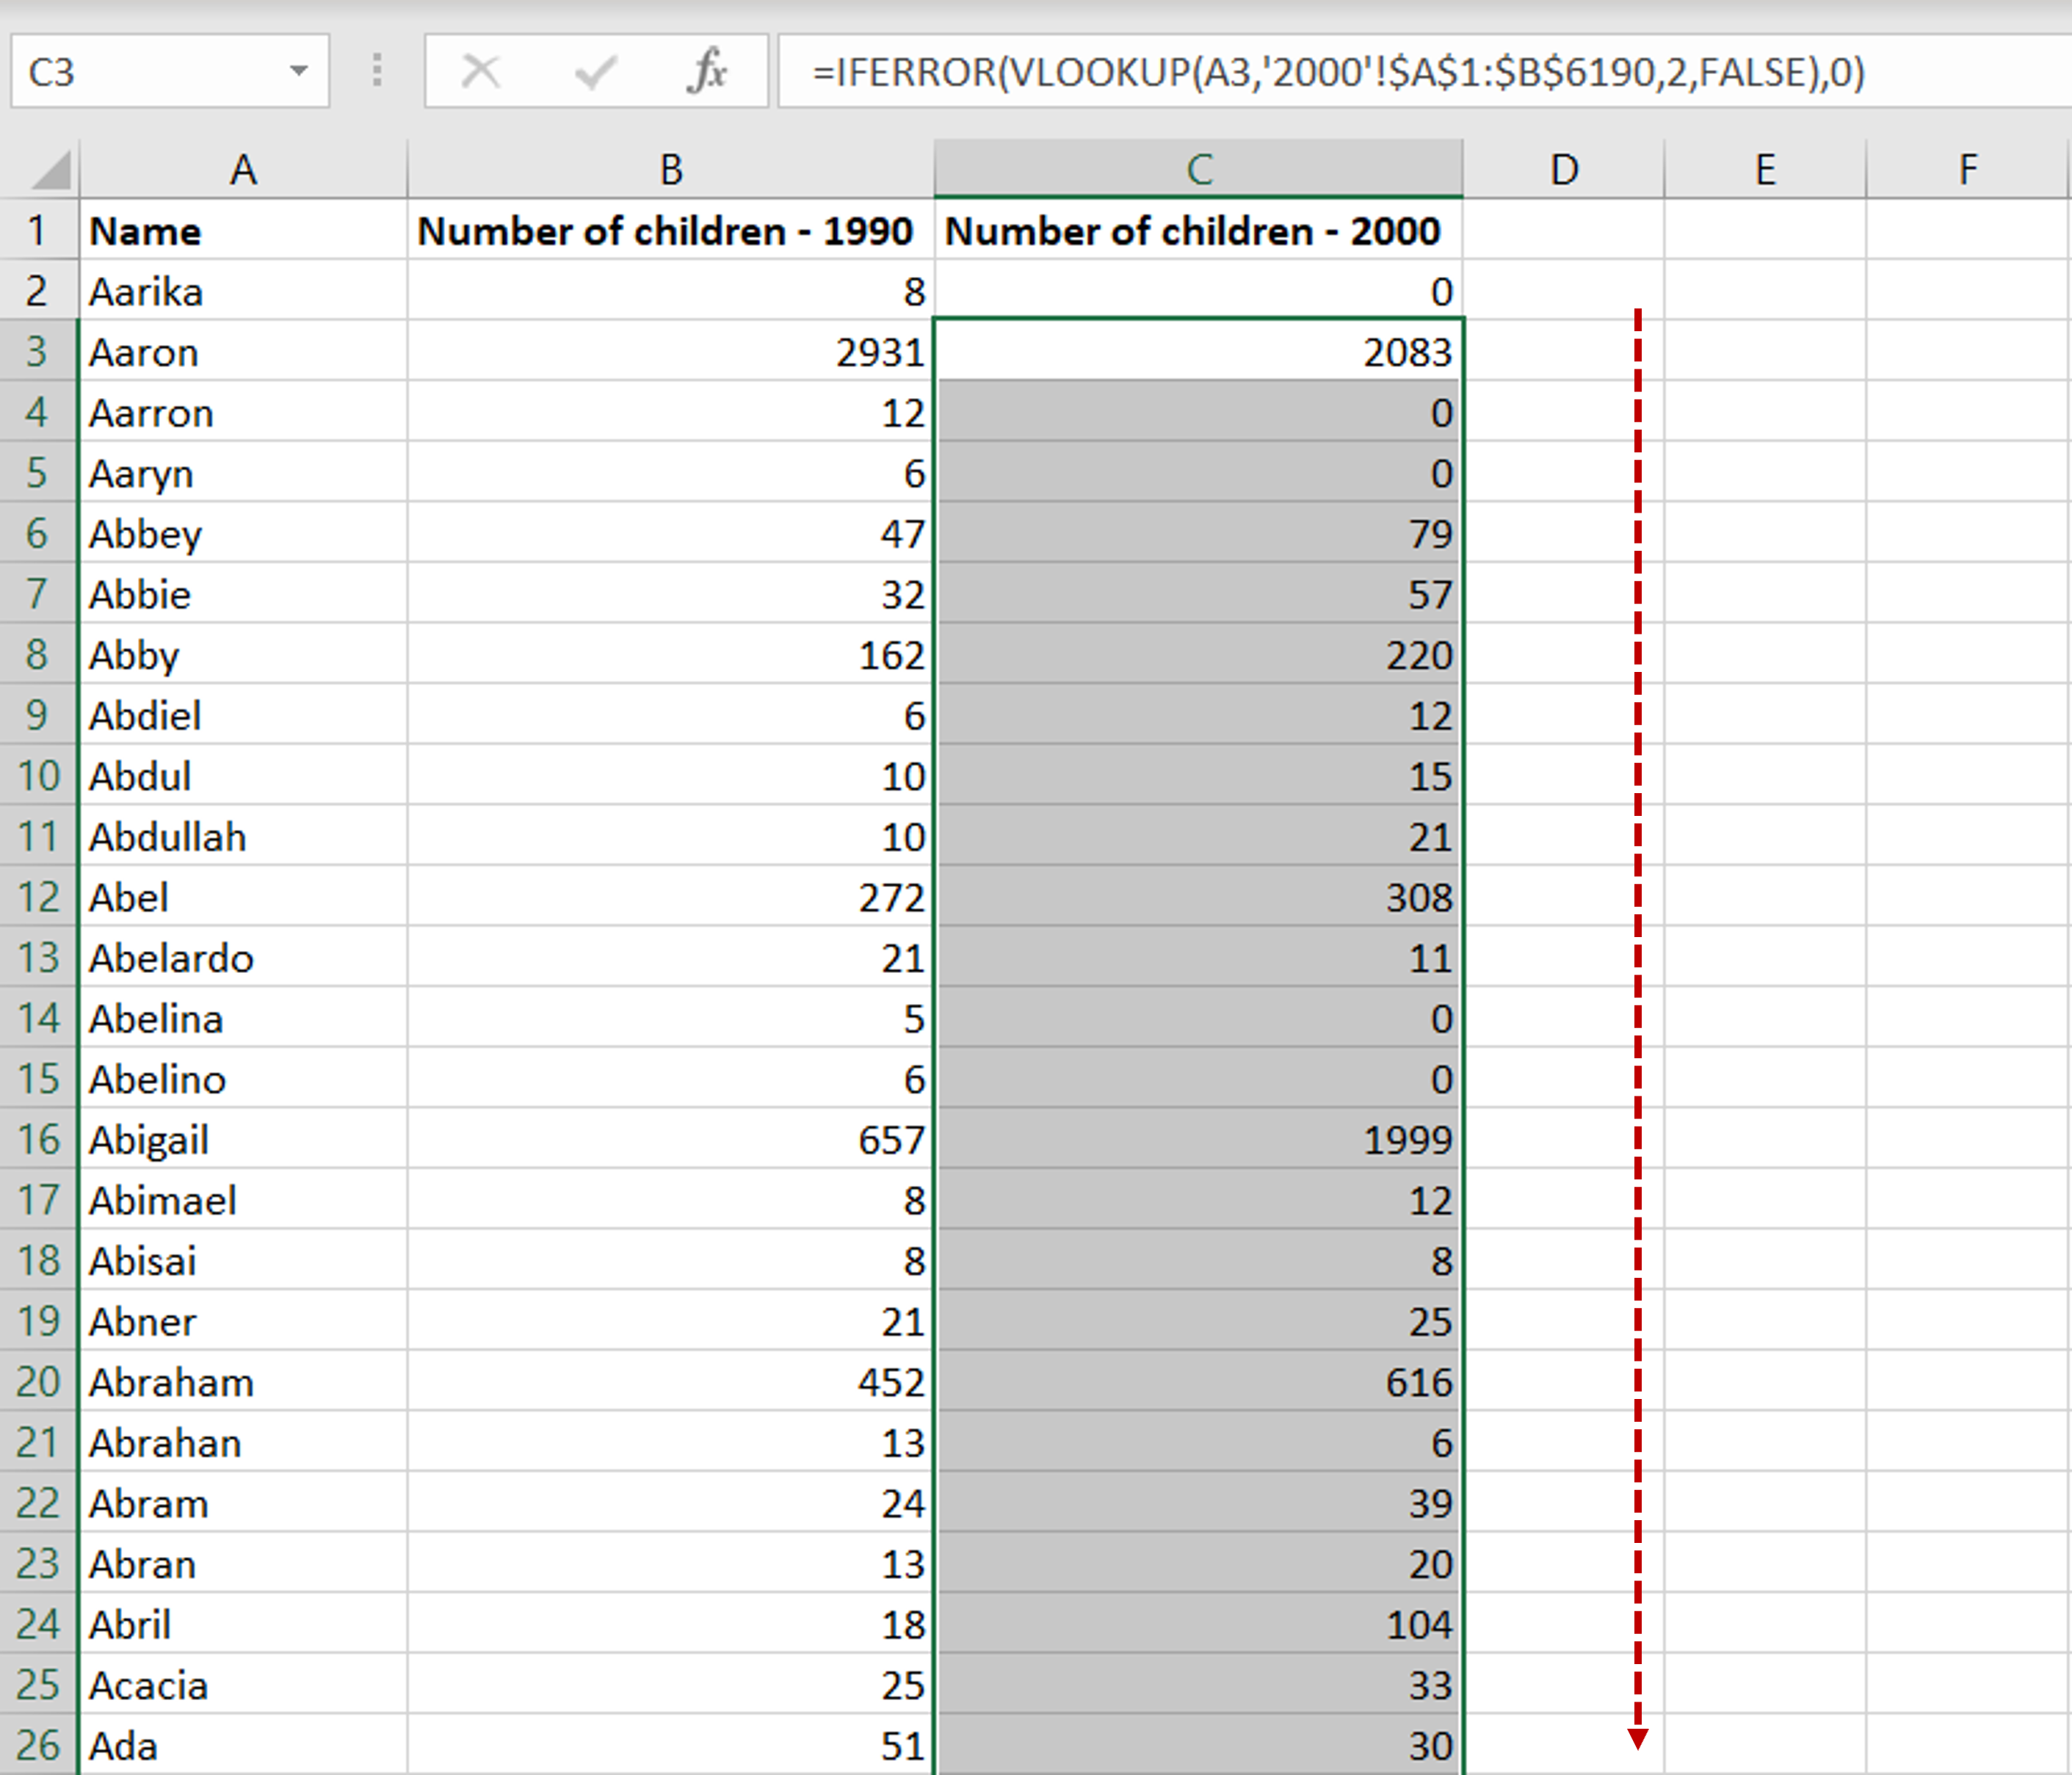
For comparing data across different sheets or columns, functions like VLOOKUP or INDEX/MATCH are invaluable:
- VLOOKUP: Searches for a value in the first column of a table and returns a value in the same row from another column.
- INDEX/MATCH: More flexible, it retrieves values based on row and column criteria, which can be used for both vertical and horizontal lookups.
🔍 Note: Remember that VLOOKUP cannot search to the left, whereas INDEX/MATCH can.
3. Subtraction and Formulaic Comparison

Direct comparison using subtraction or other formulas:
- Subtraction: Simply subtract one cell from another to see the numerical difference.
- Percentage Change: Use (A2-B2)/A2 to calculate percentage change between two cells A2 and B2.
- Absolute Difference: Use =ABS(A2-B2) to find the absolute difference, ignoring signs.
| Operation | Formula |
|---|---|
| Subtract | =A2-B2 |
| Percentage Change | =(A2-B2)/A2 |
| Absolute Difference | =ABS(A2-B2) |

4. Data Validation for Quick Comparison

Data Validation can be used to set criteria for entering data, which indirectly helps in comparing numbers:
- Create a drop-down list or set rules to limit input values, ensuring consistency and allowing for easier comparison.
5. PivotTables for Cross-Tabulation

PivotTables are excellent for summarizing and comparing large datasets:
- Drag and drop fields to create different views and comparisons of your data.
- Summarize data with functions like sum, average, or count to compare numbers across different categories or time periods.

When using PivotTables, consider:
- Group data by date, category, or other identifiers.
- Use calculated fields for custom comparisons, such as % of total or difference between actuals and forecast.
Each method provides unique insights into comparing numbers, allowing for a more informed analysis. Whether you're looking for visual cues, detailed comparisons, or aggregate summaries, Excel offers tools to meet your data comparison needs effectively.
The versatility of Excel's comparison methods means that users can tailor their approach to the specific needs of their data analysis, whether it's for financial forecasting, performance metrics, or any other numerical comparison task. By integrating these techniques, analysts can uncover patterns, verify data integrity, and make strategic decisions with confidence.
How do I use Conditional Formatting for comparing sales figures?

+
You can highlight cells where sales exceed a certain threshold with different colors, apply data bars to visualize the magnitude of sales, or use icon sets to quickly identify high, medium, or low performers.
What are the limitations of VLOOKUP when comparing data across sheets?

+
VLOOKUP is limited to searching data from left to right, cannot look up to the left of the lookup column, and is slower for large datasets compared to INDEX/MATCH.
Can I use Excel to compare data from different time periods?

+
Yes, by setting up PivotTables with dates, you can compare data across different periods by grouping dates or using calculated fields for direct comparisons.
How do I ensure data consistency when comparing numbers?

+
Data Validation can be used to enforce consistent data entry, which indirectly helps in accurate comparison by limiting the types of values that can be entered.
With these methods in hand, users of Excel can significantly enhance their data analysis capabilities, leading to more precise comparisons and better-informed decisions. By mastering these techniques, you’ll unlock Excel’s full potential in transforming raw data into actionable insights.