Combine 3 Excel Sheets into One Tableau Dashboard Easily

Have you ever been tasked with synthesizing data from multiple Excel sheets into a coherent visual summary for easier analysis and reporting? Well, Tableau can be an invaluable tool for you! Combining several Excel files into a single interactive dashboard not only saves time but also amplifies your data storytelling capabilities. In this tutorial, we'll walk through the process of combining three Excel sheets into one Tableau dashboard with ease.
Understanding the Basics

Before diving into the technical steps, it’s crucial to have a basic understanding:
- Excel Sheets: Microsoft Excel is widely used for data storage and simple analysis.
- Tableau: It’s a powerful visualization and data analysis tool that can connect to various data sources including Excel.
- Data Blending: This is the process of integrating data from multiple sources to create more comprehensive insights.
Step 1: Preparing Your Excel Sheets

Before merging your data into Tableau, ensure your Excel sheets are ready:
- Make sure all sheets have consistent column headers for the data you want to combine.
- Check for any blank rows or columns, which can cause issues in Tableau.
- Align dates and numerical formats across all sheets.
🔍 Note: If your Excel sheets contain external references or complex formulas, consider simplifying or extracting only the necessary data into a new sheet.
Step 2: Creating a Tableau Data Source

Now, let’s set up your Tableau environment:
- Open Tableau and click on “Connect” then select “Microsoft Excel.”
- Navigate to and select one of your Excel files. Tableau will create a new data source for it.
- If the Excel workbook contains multiple sheets, you might see all of them listed on the left side of the data source page.
- You can repeat this process for each Excel file, creating a separate data source for each.
Creating Union or Join

Here’s how you can combine these data sources:
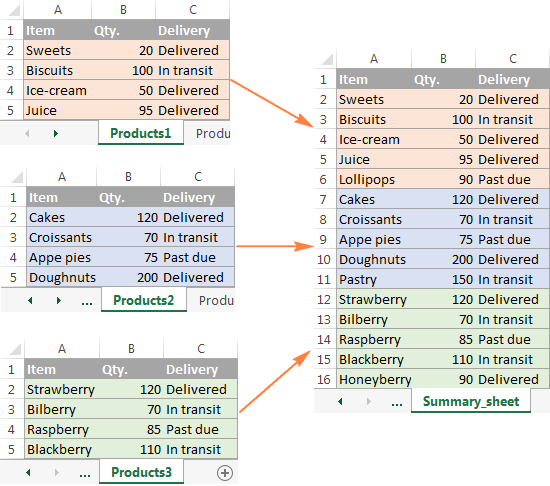
- Union: When all your sheets have identical structures, simply right-click on a sheet and select “New Union” to combine data vertically.
- Joins: If you need to combine data based on a common field, drag a second data source into the data pane and select “Add” to create a join.
Step 3: Building Your Dashboard

With your data sources combined, let’s start building the dashboard:
- Switch from the data source tab to a new worksheet by clicking on the worksheet tab below.
- Create visualizations by dragging fields onto the Rows and Columns shelves or into the visualization area.
- Use filters, pages, and marks to customize your visualizations.
- Create additional sheets for different views of your data.
| Component | Usage |
|---|---|
| Sheet | Individual visualizations. |
| Dashboard | Collection of sheets and legends to tell a story. |
| Story | Sequence of dashboards or sheets that show analysis progression. |

Linking Sheets and Actions

- Use “Actions” to enable interactivity between sheets. For example, selecting a bar in one graph might filter another chart.
- Set up dashboard actions for filtering, highlighting, or showing tooltips on interaction.
📌 Note: Remember to test your dashboard interactions to ensure everything functions smoothly as intended.
Step 4: Polishing Your Dashboard

To finalize your dashboard:
- Customize colors, fonts, and sizes to enhance readability and aesthetics.
- Add logos or images if necessary. Remember to source images appropriately.
- Use “Show/Hide Containers” to optimize space and layout.
- Ensure all visualizations have descriptive titles and clear axis labels.
Recap

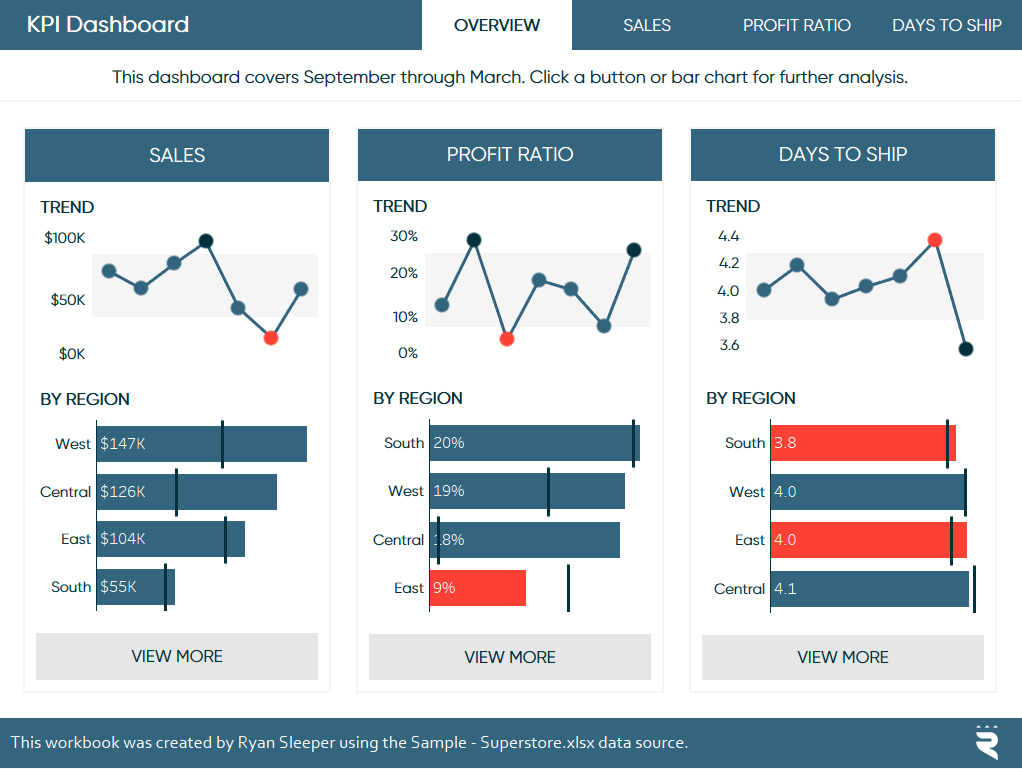
Creating a comprehensive Tableau dashboard from three Excel sheets might seem daunting at first, but with the right preparation and understanding of Tableau’s capabilities, it becomes a seamless process. From preparing your data in Excel, connecting it to Tableau, merging data sources through unions or joins, building individual sheets, and then crafting an interactive dashboard, each step builds upon the last to create a valuable tool for data analysis.
By following these steps, you've not only learned how to combine data from multiple Excel files into one Tableau dashboard but also how to present this data in a visually compelling and interactive way that enhances decision-making and storytelling. Remember to tailor your dashboard to your audience, ensuring that the insights are accessible, actionable, and aligned with your business objectives or personal analysis needs.
Can I join multiple Excel files with different structures in Tableau?

+
Yes, Tableau allows you to join or blend data from multiple sources, even if they have different structures. However, you’ll need to ensure there is at least one common field for joining. For different structures, you might need to use Tableau’s data prep tools or adjust the Excel data beforehand to make it compatible for blending.
How often should I refresh the dashboard to reflect new data from Excel?

+
This depends on your data update frequency. If Excel files are updated manually, you can refresh the dashboard manually as needed. For automated updates, consider using Tableau Server or Tableau Online, which allows for automatic data refresh schedules.
What if my Excel sheets have over 1 million rows of data?

+
Tableau can handle large datasets, but performance might degrade. Consider the following:
- Extract only the necessary data into Tableau.
- Use Tableau’s data extracts which can improve performance over live connections.
- If still facing issues, consider using Tableau Server or Online, which offer better performance for large datasets.