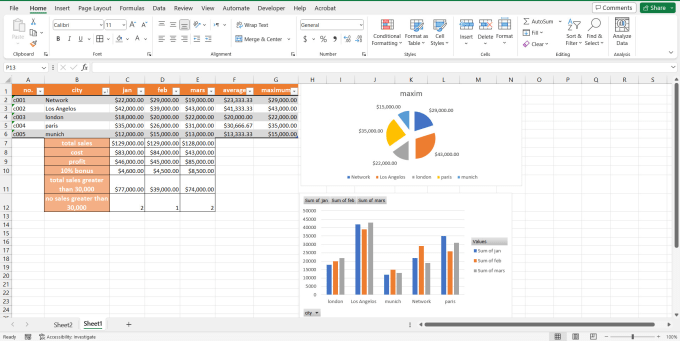
7 Proven Tips to Make Your Excel Sheet Look Fantastic

Excel, often recognized solely for its calculation capabilities, is actually a powerful tool for data presentation, as well. With its wide array of formatting options, you can transform a simple spreadsheet into an engaging, visually appealing report or dashboard. Here are seven proven tips to elevate the visual appeal of your Excel sheets:
1. Use Consistent Color Schemes

Color can significantly enhance the readability of your Excel data. Here’s how you can effectively use color:
- Set a color theme: Use Excel’s built-in themes or customize your own for a consistent look.
- Highlight important data: Use bold or contrasting colors for key figures or headers.
- Avoid clashing colors: Stick to a palette that complements each other to prevent visual chaos.

💡 Note: Overusing colors can make your sheet look cluttered. Less is often more in professional settings.
2. Employ Data Bars and Conditional Formatting

Conditional formatting helps you visualize data trends at a glance:
- Data Bars: Fill cells with horizontal bars proportional to the cell’s value.
- Color Scales: Use a range of colors to highlight high, average, and low values.
- Icon Sets: Add icons to indicate status, like flags or arrows.

💡 Note: Conditional formatting should be used judiciously to avoid overwhelming the viewer.
3. Organize with Cell Styles

Excel provides a variety of styles that can make your sheet look more polished:
- Predefined Cell Styles: Use styles like ‘Accent 1’, ‘Good’, ‘Neutral’, etc., to give your sheet a professional touch.
- Custom Styles: Create your own styles to ensure consistency across multiple sheets or workbooks.
💡 Note: Always keep track of custom styles you’ve made to maintain uniformity in future work.
4. Insert SmartArt and Charts

Visual representations can communicate complex data more effectively:
- SmartArt: Use to illustrate processes, hierarchies, or cycles.
- Charts: From pie charts to line graphs, choose what best represents your data.

💡 Note: Ensure your charts are labeled correctly with clear titles, legends, and axes descriptions.
5. Utilize Grouping and Hiding Features

Make your sheet user-friendly:
- Group Rows or Columns: Collapse and expand data for cleaner presentation.
- Hide Rows or Columns: Remove clutter by hiding less important data.
💡 Note: Users should still be able to access hidden data if needed; avoid over-hiding critical information.
6. AutoFit and Merge Cells

Adjust your sheet for better readability:
- AutoFit: Automatically resize columns or rows to fit content.
- Merge Cells: Combine cells to create headings or to center titles over multiple columns.
💡 Note: While merging cells can be visually appealing, overuse can complicate data management.
7. Add Headers and Footers

Professional finishing touches:
- Headers: Include report titles, date, or page numbers.
- Footers: Use for disclaimers, additional information, or contact details.
| Element | Use Case |
|---|---|
| Header | To display document title, date, and version number. |
| Footer | For copyright notices, page numbers, or company branding. |

To sum up, creating an aesthetically pleasing Excel sheet involves a careful balance between functionality and visual appeal. By employing consistent color schemes, using conditional formatting, organizing data with cell styles, incorporating visual elements like SmartArt and charts, and effectively utilizing grouping, hiding, auto-fit, merging, and headers/footers, you can make your spreadsheets both informative and visually striking. Remember that the goal is not just to make the sheet look good but to enhance its utility and readability for your audience.
How can I ensure my Excel sheets are accessible for colorblind users?

+
Use patterns, textures, or distinct colors that differ in hue and lightness. Additionally, adding labels or descriptions next to color-coded data can help.
Can I automate the formatting of an Excel sheet?

+
Yes, by using macros or VBA (Visual Basic for Applications), you can automate repetitive formatting tasks to maintain consistency.
What’s the best way to make my Excel dashboard interactive?

+
Utilize features like slicers, timelines, and interactive charts with filters to allow users to engage with your data dynamically.
Is it possible to save custom Excel formatting for future use?

+
Yes, you can save custom styles in a template or export/import cell styles for reuse.