5 Easy Steps to Find T-Critical Value in Excel

Mastering statistical analysis can be a key skill in many professional fields, including research, quality control, finance, and data analysis. One common task in statistics is finding the T-critical value which is essential for hypothesis testing. Excel, a widely used tool in these domains, provides an intuitive platform to perform this task. In this post, we will guide you through the five easy steps to find the T-critical value in Excel.
Step 1: Open Excel and Prepare Your Data

First, open Excel and ensure you have a blank worksheet ready for your calculations. Here’s how to prepare:
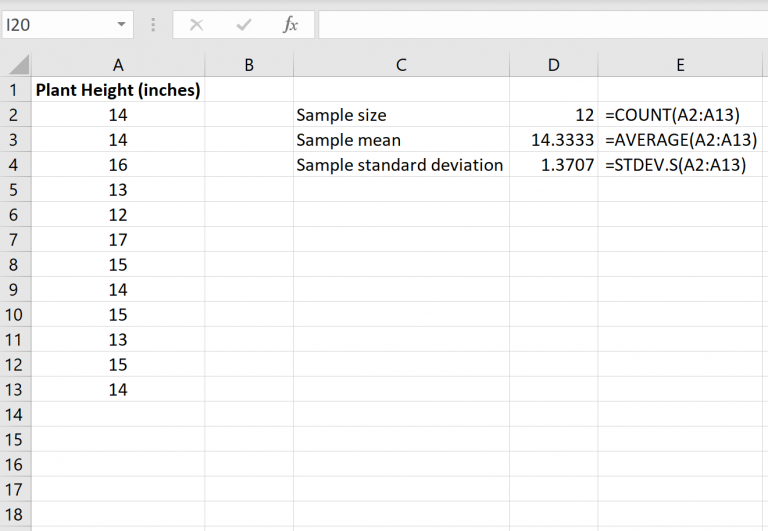
- Insert your degrees of freedom (df) value into a cell. Remember, df = n - 1, where n is the number of observations in your sample.
- Decide your significance level (alpha), common values are 0.05 for a 95% confidence level.
Example: If your sample size is 30, your df will be 29.
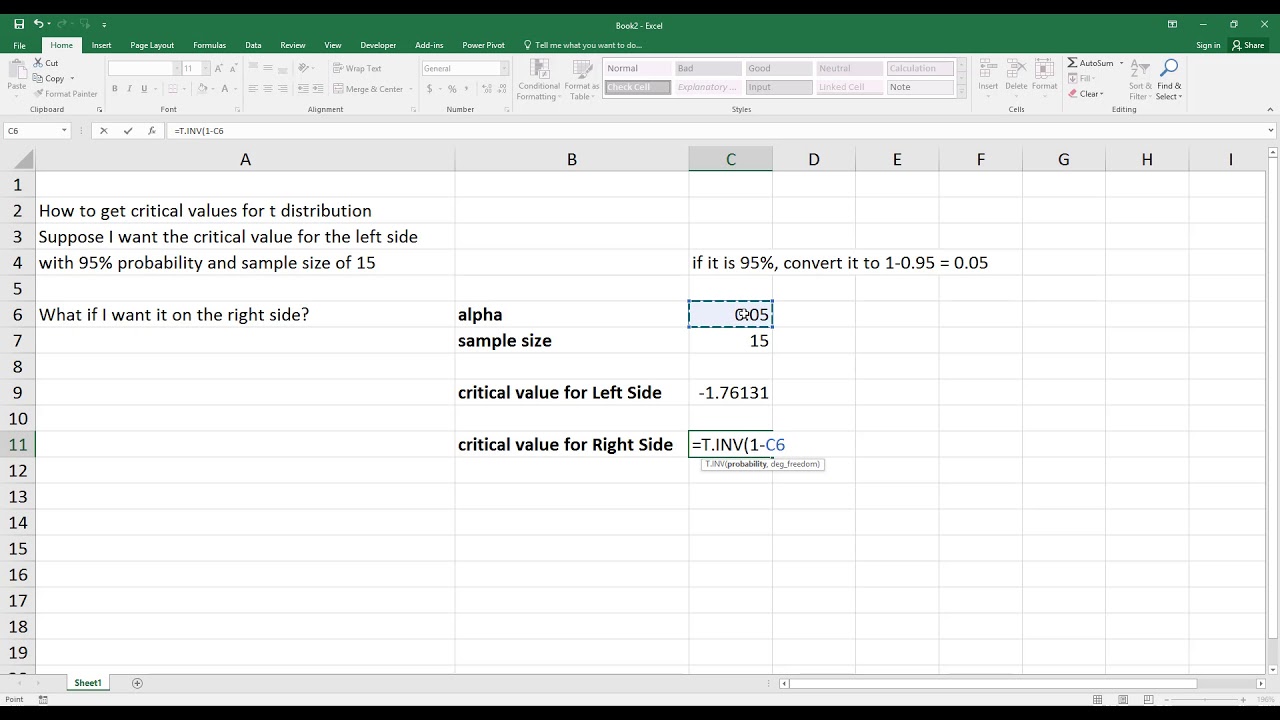
Step 2: Access the T.INV.2T Function

To find the T-critical value for a two-tailed test:
- Click on an empty cell where you want the result to appear.
- Go to the ‘Formulas’ tab, click on ‘Insert Function’.
- In the search box, type “T.INV.2T” and select it from the list.
Step 3: Enter Your Parameters

In the ‘Function Arguments’ window:
- Set the Probability to your chosen alpha level (e.g., 0.05).
- Enter the degrees of freedom in the Deg_freedom field.
- Click ‘OK’ to get your T-critical value.
Step 4: Interpret Your Results

The T-critical value you’ve calculated represents the cutoff for your t-distribution at your chosen significance level:
- Values beyond this number (either positively or negatively) indicate statistical significance at the level you set.
Step 5: Visualize and Report

To make your findings more compelling:
- Create a t-distribution chart to visualize where your T-critical value lies.
- Include this chart in reports or presentations for better clarity.
Example:

Here is a simplified table showing the relationship between degrees of freedom and T-critical value at different alpha levels:
| Degrees of Freedom | α = 0.1 | α = 0.05 | α = 0.01 |
|---|---|---|---|
| 20 | 1.325 | 2.086 | 2.845 |
| 30 | 1.310 | 2.042 | 2.750 |
| 40 | 1.303 | 2.021 | 2.704 |

⚠️ Note: Ensure that your Excel version supports the T.INV.2T function; older versions might require different functions like TINV.
By following these steps, finding the T-critical value in Excel becomes a straightforward task, enhancing your ability to perform precise hypothesis testing. This skill not only makes your statistical analyses more robust but also helps in making data-driven decisions with confidence.
Frequently Asked Questions

What is the T-critical value used for?

+
The T-critical value is used to determine the critical region in hypothesis testing, where values beyond this threshold indicate statistical significance.
How does the degrees of freedom impact the T-critical value?

+
As the degrees of freedom increase, the T-critical value decreases, reflecting the t-distribution becoming closer to a normal distribution with larger sample sizes.
Can you use Excel for all statistical analyses?

+
While Excel can perform many basic and intermediate statistical analyses, specialized statistical software like R or SPSS might be needed for advanced or complex analyses.
Is there an alternative function to T.INV.2T?

+
Yes, older versions of Excel use TINV for two-tailed tests, while T.INV for one-tailed tests.