3 Simple Steps to Calculate P-Value in Excel

3 Simple Steps to Calculate P-Value in Excel

The p-value is an essential statistical metric that helps us determine the significance of our results when performing hypothesis tests. Whether you’re analyzing A/B testing data or comparing two groups, Excel can be an incredibly useful tool for calculating this crucial value. Here are the three simple steps to get you started:
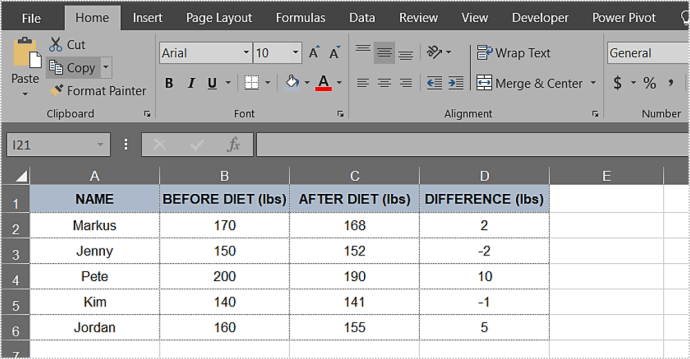
Step 1: Data Setup

Before calculating the p-value, you need to organize your data correctly:
- Arrange your two samples into separate columns.
- Label the columns appropriately to avoid confusion later on.
Step 2: Choose the Right Test

Selecting the appropriate statistical test is vital for accurate p-value calculation:
- Use the T-Test for comparing means of two groups:
- Two-Sample T-Test if the variances are different.
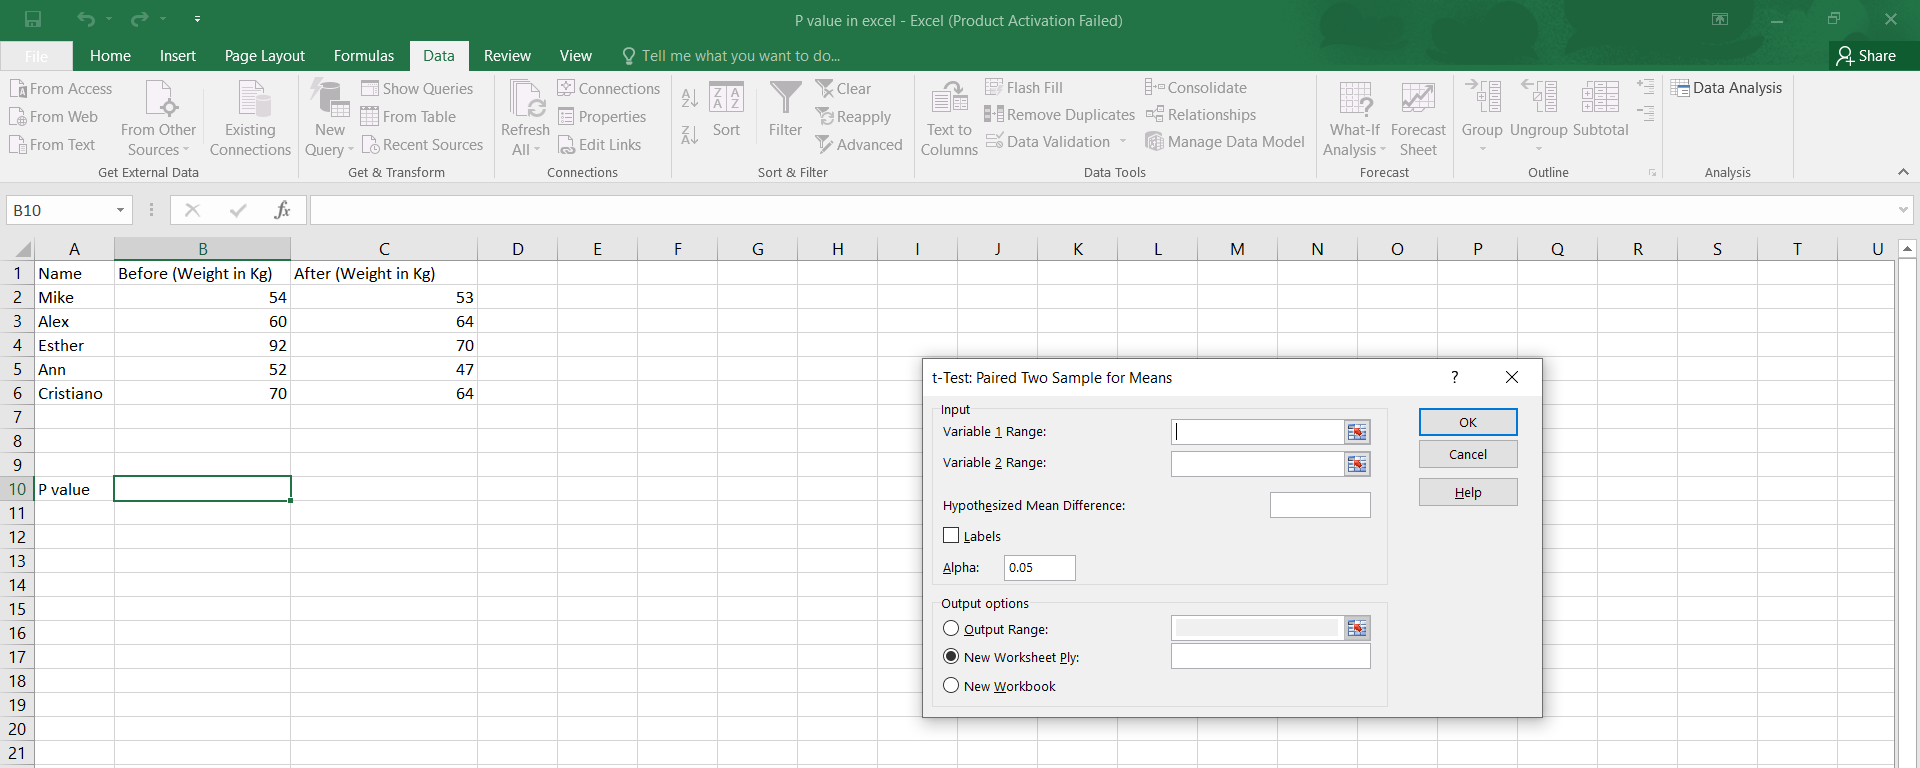
- Paired T-Test if you’re measuring the same subjects under different conditions.
- For distribution-free tests, consider using:
- Wilcoxon Signed-Rank Test for ordinal or continuous data.
- Mann-Whitney U Test for comparing distributions.
Step 3: Calculate the P-Value

Once you’ve set up your data and chosen the correct test, follow these steps:
Using T-TEST function:

- Select an empty cell where you want your p-value to appear.
- Enter the formula:
=T.TEST(array1, array2, tails, type), where: array1andarray2are the cell ranges of your samples.tailscan be 1 (one-tailed test) or 2 (two-tailed test).typespecifies the kind of t-test:- 1 for paired sample test.
- 2 for two-sample equal variance (homoscedastic).
- 3 for two-sample unequal variance (heteroscedastic).
📝 Note: If using Excel 365 or later versions, consider using the updated T.TEST function which provides more precise results.
Using Alternative Methods:

If you need a non-parametric test:
- Download an Excel add-in like Real Statistics Resource Pack or use VBA macros for tests like the Wilcoxon or Mann-Whitney.
⚠️ Note: Always validate your results with traditional statistics tools or academic software to ensure accuracy in complex scenarios.
Now that you've calculated your p-value, interpreting it is key:
- A low p-value (typically less than or equal to 0.05) suggests that your results are statistically significant.
- A high p-value indicates that there isn't enough evidence to reject the null hypothesis.
To wrap up, calculating p-values in Excel not only simplifies the analysis process but also makes it more accessible for individuals who might not be well-versed in statistical software. Following these steps, you can harness the power of Excel for hypothesis testing, ensuring your research or analysis is backed by solid statistical evidence. Remember, statistics is about making informed decisions, and Excel is an incredible ally in this journey.
Why is the p-value important?

+
The p-value helps you understand the significance of your results in hypothesis testing, indicating whether your findings are due to random chance or a real effect.
What does a low p-value mean?

+
A low p-value suggests that there is a statistically significant difference between your test groups, making it unlikely that the observed effect is due to chance alone.
How can I verify the p-value calculated in Excel?

+
To verify the p-value, you can cross-check it using statistical software like R, SPSS, or even hand calculations if you understand the underlying math of the test used.
What’s the difference between one-tailed and two-tailed tests?

+
In a one-tailed test, you are testing for an effect in one direction only. A two-tailed test checks for the possibility of an effect in either direction.