3 Easy Steps to Calculate Confidence Interval in Excel

When analyzing statistical data, understanding the level of uncertainty in your estimates can be as crucial as the data itself. One key tool that statisticians and data analysts use to communicate this uncertainty is the Confidence Interval (CI). Excel, with its powerful suite of functions, can simplify the process of calculating Confidence Intervals, making it accessible even to those with a basic understanding of statistics. This blog post will guide you through three straightforward steps to calculate a Confidence Interval in Excel, with emphasis on why this is important and how it can benefit your data analysis.
Why Calculate Confidence Intervals?

Confidence Intervals provide a range of values which is likely to contain the true population parameter with a certain degree of confidence. Here’s why they matter:
- Assessment of Precision: A narrower interval indicates more precise results, whereas a broader interval indicates more variability or less certainty about the population parameter.
- Decision Making: They help in decision-making processes, where knowing the range of possible values rather than a point estimate gives a fuller picture.
- Communicating Uncertainty: Confidence Intervals allow researchers and analysts to communicate the level of certainty or uncertainty in their estimates effectively.
Step 1: Gather Your Data

Before you start calculating the Confidence Interval in Excel, you’ll need to prepare your data:
- Collect your sample data. This should be a representative subset of the population you’re analyzing.
- Enter this data into an Excel spreadsheet. Ensure that your data is clean, organized, and free from errors.

Step 2: Calculate the Mean and Standard Error

Once you have your data organized:
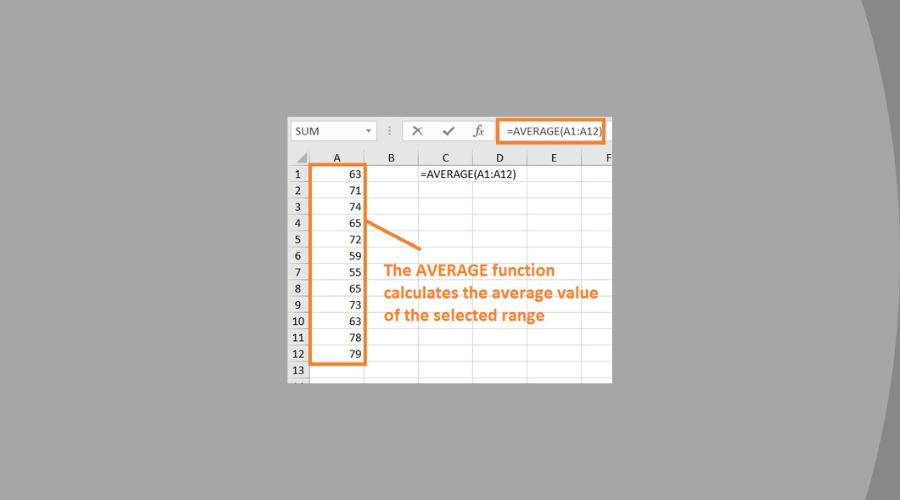
- Calculate the sample mean (X̄) using the AVERAGE function:
=AVERAGE(A2:A[your_last_cell]) - Compute the sample standard deviation (s) using the STDEV.P function for the population standard deviation or STDEV.S for the sample standard deviation:
=STDEV.P(A2:A[your_last_cell])or=STDEV.S(A2:A[your_last_cell]) - Determine the sample size (n) with the COUNT function:
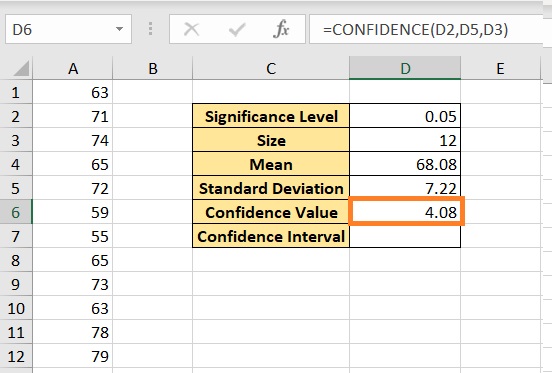
=COUNT(A2:A[your_last_cell]) - Calculate the Standard Error (SE) with the formula:
=STDEV.P(A2:A[your_last_cell]) / SQRT(COUNT(A2:A[your_last_cell]))
💡 Note: The choice between STDEV.P and STDEV.S depends on whether you're dealing with the entire population or just a sample. For most practical applications in data analysis, you'll be using STDEV.S.
Step 3: Calculate the Confidence Interval

Now you’re ready to compute the Confidence Interval:
- Choose your desired confidence level. Common values include 90%, 95%, or 99%. A 95% confidence level is commonly used.
- Use the T.INV function to find the critical value from the t-distribution:
=T.INV(1 - ((1 - [confidence level as decimal]) / 2), COUNT(A2:A[your_last_cell]) - 1)For a 95% confidence interval, this would be:=T.INV(0.975, COUNT(A2:A[your_last_cell]) - 1) - Calculate the margin of error (ME):
= [T.INV function result] * [Standard Error] - The Confidence Interval is then:
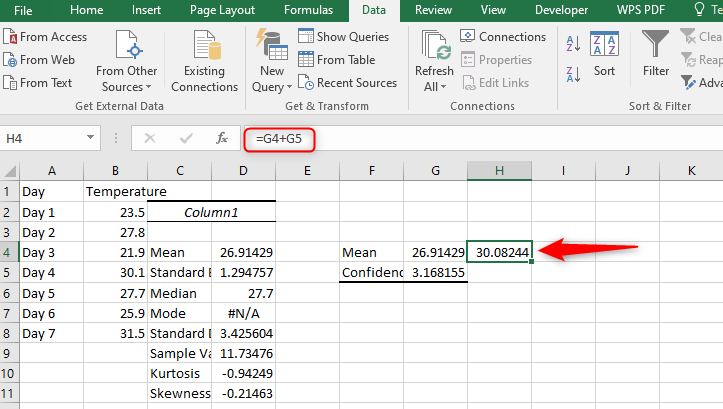
= [Mean] - [Margin of Error] to [Mean] + [Margin of Error]
| Cell | Formula |
|---|---|
| B2 | =AVERAGE(A2:A10) |
| B3 | =STDEV.S(A2:A10) |
| B4 | =COUNT(A2:A10) |
| B5 | =B3 / SQRT(B4) |
| B6 | =T.INV(0.975, B4 - 1) |
| B7 | =B6 * B5 |
| B8 | =B2 - B7 |
| B9 | =B2 + B7 |

In wrapping up this guide on calculating Confidence Intervals in Excel, we've explored why they are essential for statistical analysis. We've gone through gathering data, computing necessary statistics like the mean and standard error, and finally calculating the Confidence Interval itself. By understanding these three steps, you can effectively quantify the uncertainty around your point estimates, aiding in better decision-making and data presentation. Remember, the precision of your interval depends on the quality and quantity of your data, so always aim for a representative sample.
What is the difference between Confidence Level and Confidence Interval?

+
Confidence Level indicates the probability that the confidence interval will contain the true population parameter. For example, a 95% confidence level means that if you were to take 100 different samples and compute a CI for each, about 95 of them would contain the true mean. The Confidence Interval itself is the range of values derived from the sample data, providing an estimate of where the true population parameter might lie with the stated confidence level.
How do I interpret a Confidence Interval?

+
To interpret a Confidence Interval, consider that with a given confidence level (like 95%), you are 95% confident that the interval contains the true population parameter. For instance, if your CI for the population mean is 10 to 20, you can say you’re 95% confident that the true mean lies somewhere between these two values.
Can I use Confidence Intervals for proportions?

+
Yes, Confidence Intervals can be calculated for proportions using a similar approach. Instead of the sample mean, you would use the sample proportion, and the standard error calculation would involve the proportion and sample size. Excel functions like BINOM.INV can be helpful in these scenarios.
What if my data isn’t normally distributed?

+
If your data doesn’t follow a normal distribution, you can still calculate a CI, but you might need to use alternative methods or distributions like the non-parametric bootstrap or adjustments to the standard error calculation to account for non-normality.