Calculate ANOVA in Excel: Step-by-Step Guide

Analyzing data through variance analysis, commonly known as ANOVA, is a statistical method widely used in various fields like research, marketing, and biology to compare means of three or more samples to understand if there are significant differences between them. This guide will walk you through performing ANOVA in Excel, helping you to analyze your data effectively.
Preparation of Data

Before diving into ANOVA, your data must be properly formatted:
- Each group should have its own column, with the group name as the header.
- Data should be numerical and continuous.
- Empty cells, text, or error values should be eliminated.
Performing ANOVA in Excel

Step 1: Data Entry

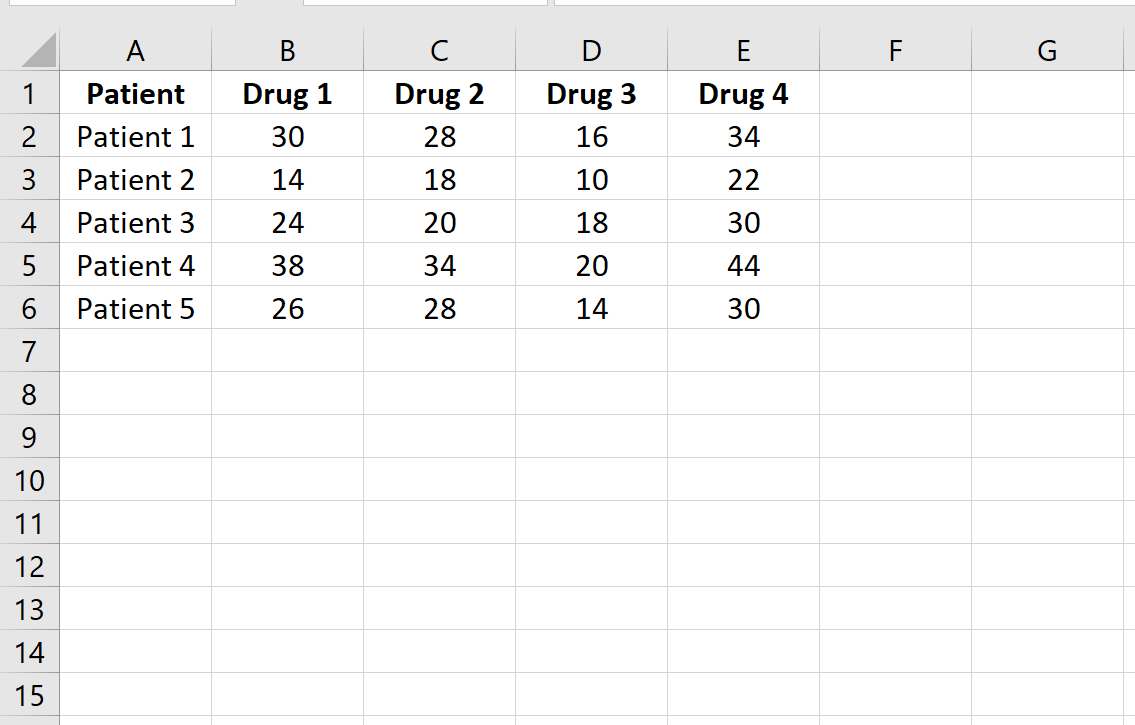
Begin by entering your data into Excel:
| Group 1 | Group 2 | Group 3 |
|---|---|---|
| 34 | 23 | 45 |
| 27 | 32 | 47 |
| 29 | 28 | 42 |

Step 2: Activate the Analysis ToolPak

The Analysis ToolPak is an add-in that provides advanced statistical functions:
- Go to the File tab and click Options.
- Select Add-ins, and in the Manage box, click Go.
- Check Analysis ToolPak, then click OK.
Step 3: Running the ANOVA Test

Once the add-in is activated, here’s how to run ANOVA:
- Click on the Data tab, then Data Analysis.
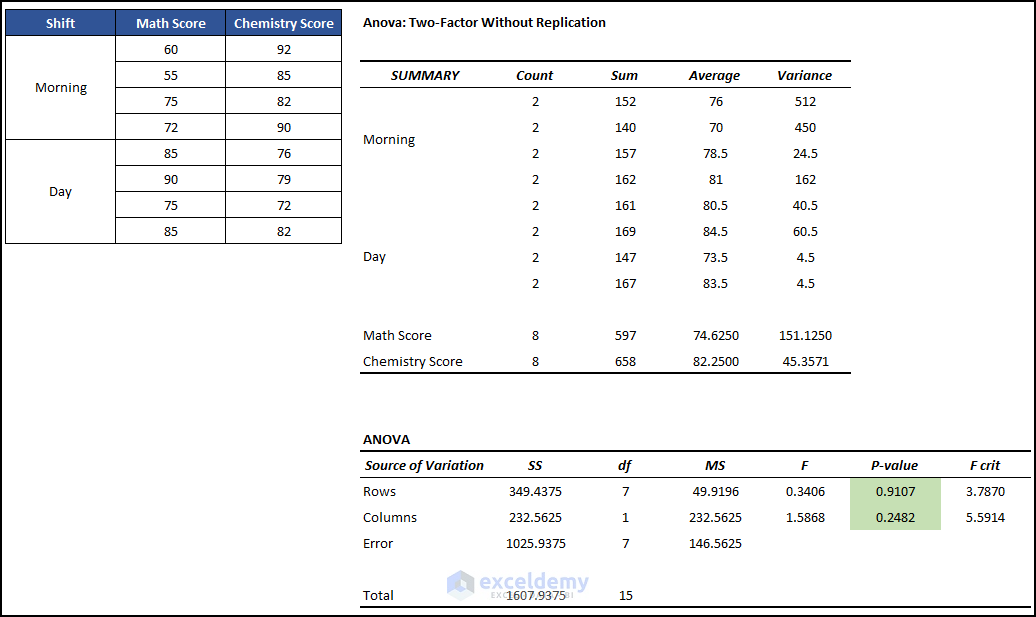
- Select ANOVA: Single Factor or ANOVA: Two-Factor With Replication based on your needs.
- In the Input Range, select your data range, including headers.
- Set the Alpha value to your preferred significance level (usually 0.05).
- Click OK.
Step 4: Interpreting Results

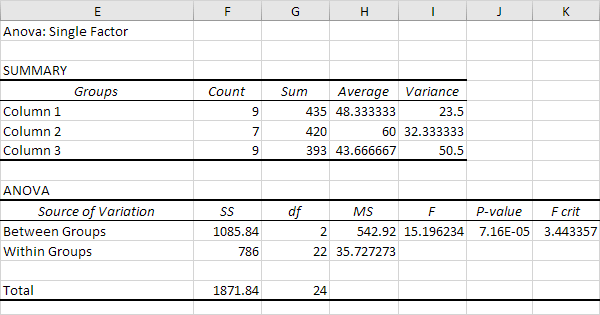
Excel will display:
- Source of Variation: Between Groups, Within Groups.
- Sum of Squares: Indicates the total variation within and between groups.
- df (Degrees of Freedom): Number of independent values used in calculation.
- Mean Square: Sum of Squares divided by Degrees of Freedom.
- F Ratio: Used to test the significance of the results.
- P-value: If less than or equal to your alpha, it indicates significance.
⚠️ Note: The F Ratio helps determine if the observed differences in group means are statistically significant. If the P-value is less than or equal to your alpha, you reject the null hypothesis, suggesting group means differ significantly.
Additional Tips

- Ensure your data is clean and formatted correctly to avoid errors.
- Use ANOVA: Two-Factor if you’re analyzing two variables simultaneously.
- Post-hoc tests might be necessary if ANOVA indicates significance to pinpoint which groups differ.
This guide has detailed the process of executing ANOVA in Excel, from data preparation to interpreting results. ANOVA is invaluable for uncovering insights by comparing multiple groups. While Excel provides a user-friendly platform for these analyses, it's crucial to ensure your data is well-prepared and you understand the implications of the results for your study or business.
What is ANOVA?

+
ANOVA, or Analysis of Variance, is a statistical method used to compare the means of three or more samples to understand if at least one group mean is significantly different from the others.
Can I run ANOVA on Excel?

+
Yes, Excel offers tools for performing ANOVA via the Analysis ToolPak add-in, which must be activated before you can use it.
What does the P-value in ANOVA represent?

+
The P-value represents the probability of obtaining results at least as extreme as the observed results under the null hypothesis. A smaller P-value suggests a lower likelihood that the observed differences in group means occurred by chance.