Master Excel Sheet Creation: Easy Step-by-Step Guide

Creating an Excel spreadsheet might seem daunting at first, but with this easy step-by-step guide, you'll be organizing, analyzing, and presenting data like a pro. Excel, a powerhouse application from Microsoft Office suite, offers a plethora of tools to manage all your data needs efficiently. Whether you're looking to track expenses, manage project timelines, or organize extensive databases, Excel's vast capabilities make it an indispensable tool for both personal and professional use.
Getting Started with Excel


Upon launching Excel, you’re greeted with a blank canvas, ripe for your data manipulation artistry:
- Open Excel: Click the Excel icon on your desktop or navigate via the Windows Start menu.
- Create a New Workbook: Click on 'File', then 'New', and choose 'Blank Workbook'.
Understanding the Excel Interface

The Excel interface might appear complex, but breaking it down is quite straightforward:
| Component | Description |
|---|---|
| Ribbon | A collection of toolbars at the top, housing various functions in tabs like 'Home', 'Insert', 'Page Layout', etc. |
| Formula Bar | Where you input or edit formulas or data for the active cell. |
| Column Headers | Letters across the top (A, B, C...) indicating columns. |
| Row Headers | Numbers down the side (1, 2, 3...) indicating rows. |

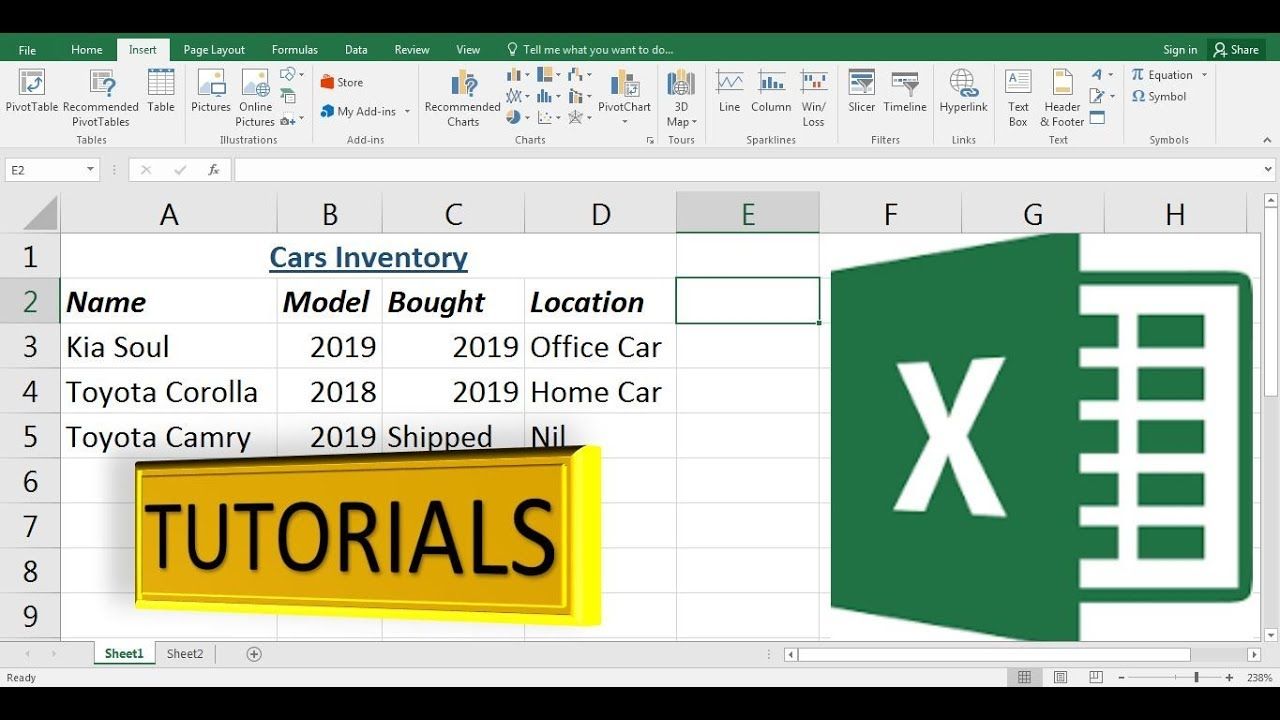
Entering Data into Excel

Here’s how to start entering your data:
- Select a Cell: Click on the cell where you want to place data.
- Type Data: Begin typing your data directly into the selected cell.
- Confirm Entry: Press Enter or move to another cell to confirm your entry.
💡 Note: Use the 'Tab' key to move across cells horizontally and the arrow keys or mouse for navigation.
Basic Excel Formulas and Functions

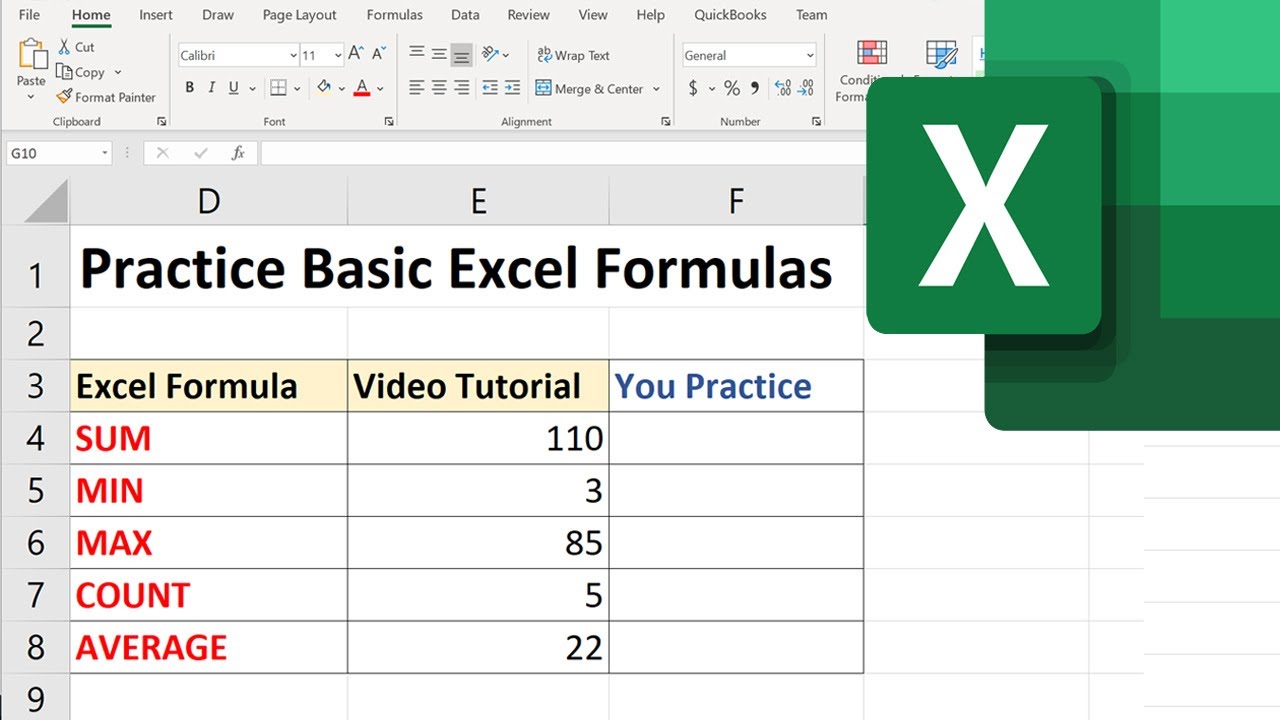
Excel’s strength lies in its ability to perform calculations via formulas. Here’s a quick dive into some basic formulas:
Sum Function

The SUM function calculates the total of selected cells:
=SUM(A1:A10)
This sums all numbers from cell A1 to A10.
Average Function

To calculate the average:
=AVERAGE(B2:B5)
This averages the values in cells B2 through B5.
IF Function

The IF function checks a condition and returns one value if true and another if false:
=IF(C2>100, “High”, “Low”)
This formula checks if the value in C2 is greater than 100, returning “High” if true, and “Low” if false.
Formatting Your Spreadsheet

After entering your data, give it a polished look:
- Font Style & Size: Use 'Home' tab to adjust text appearance.
- Cell Borders: Apply borders to define cell boundaries.
- Color & Fill: Highlight important cells with color.
- Number Formatting: Format numbers as currency, percentages, or dates.
Using Tables in Excel

Organize data with tables for enhanced functionality:
- Select Your Data Range: Click and drag over your data.
- Insert Table: From 'Insert' tab, choose 'Table'.
- Customize: Use the 'Design' tab to modify table styles, headers, and filters.
Creating Charts for Data Visualization

Visualize data with charts:
- Select Data: Highlight the cells you want to chart.
- Insert Chart: From the 'Insert' tab, select your chart type (e.g., Column, Line, Pie).
- Customize: Use 'Chart Design' and 'Format' tabs to adjust appearance.
Conclusion: Wrapping Up

Mastering Excel spreadsheet creation involves understanding how to navigate and manipulate the interface, enter and format data, apply formulas for calculations, and visualize information with charts. With practice, these skills will not only enhance your productivity but also make managing your data a smoother and more intuitive process. Whether for personal budgeting, business analysis, or academic research, Excel stands as your versatile ally in the realm of data management.
What is the difference between a formula and a function in Excel?

+
A formula in Excel is any expression that calculates a value; it can include functions but also constants or cell references. A function is a predefined formula that performs specific operations.
Can I use Excel for project management?

+
Yes, Excel can be used for project management. With features like conditional formatting, Gantt charts, and data validation, it provides tools to track timelines, resources, and project status effectively.
Is it possible to automate tasks in Excel?

+
Absolutely! Excel supports automation through macros using VBA (Visual Basic for Applications). These macros can automate repetitive tasks, from formatting to data manipulation, saving time and reducing errors.