Excel Master Sheet Analysis: Tips and Tricks

An Introduction to Excel Master Sheet Analysis

Microsoft Excel is not just a spreadsheet tool; it’s a robust platform for data analysis, reporting, and management. At the heart of effective data analysis in Excel lies the concept of the master sheet. A master sheet acts as the central repository for all data, ensuring accuracy and providing a foundation for all subsequent analyses. Here, we delve into tips and tricks for mastering this crucial aspect of Excel.
Why Use a Master Sheet?

Before diving into how to create and utilize a master sheet, let’s understand why it’s indispensable:
- Data Consistency: Keeps all your data in one place, reducing errors due to duplication or missing entries.
- Efficiency: Saves time in data retrieval and reporting by having all data centralized.
- Collaboration: Enhances team collaboration by providing a single source of truth for analysis.
- Data Security: Allows for better control over who can access, modify, or view the data.
Setting Up Your Excel Master Sheet

1. Gather All Data

Start by collecting all the data you need. This includes:
- Raw data from databases, spreadsheets, or external sources.
- Processed data from previous analyses.
- Historical data for trend analysis.
2. Structure Your Sheet

Organize your data for ease of use:
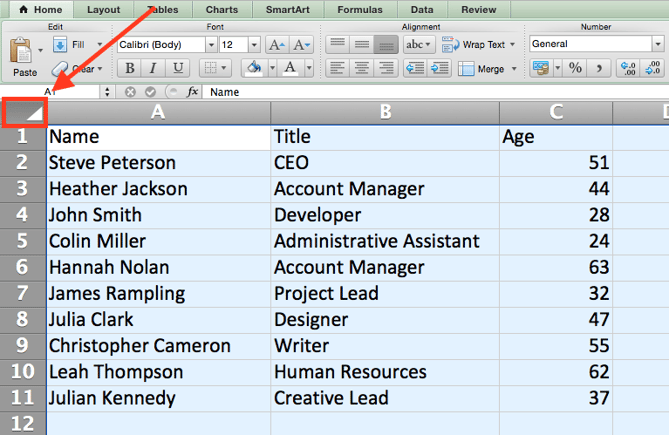
- Use the first row for headers to describe each column.
- Ensure each column contains data of the same type (e.g., dates in one column, numbers in another).
- Freeze panes to keep headers visible while scrolling through data.
🚫 Note: Avoid merging cells as they can complicate sorting, filtering, or data manipulation.
3. Utilize Naming Conventions

Naming your sheet and ranges is essential for:
- Clarity when referencing data.
- Enhancing formulas to be more readable.
- Allowing for dynamic changes when data expands.
⚠️ Note: Use short, descriptive names, avoiding spaces to minimize errors in formula references.
Effective Data Validation

Data validation ensures the integrity of your master sheet:
- Set rules for data entry to prevent errors (e.g., date formats, numerical ranges).
- Use drop-down lists for standard entries like ‘Status’ or ‘Category’.
- Implement conditional formatting to highlight anomalies or important data points.
Leveraging Formulas and Functions

Formulas and functions are the backbone of data analysis:
- VLOOKUP/HLOOKUP: For cross-referencing data from different tables.
- INDEX and MATCH: More flexible and powerful than VLOOKUP.
- SUMIFS, AVERAGEIFS, COUNTIFS: For conditional summations or calculations.
- PivotTables: Dynamic summarization of large datasets.
📝 Note: Formulas like VLOOKUP can slow down large sheets; consider using INDEX and MATCH for better performance.
Data Analysis Tools in Excel

1. PivotTables and PivotCharts

For dynamic analysis:
- Summarize large datasets by dragging fields into rows, columns, values, or filters.
- Quickly change data visualization by altering the pivot table.
- Generate charts directly from PivotTables for visual analysis.
2. Advanced Filtering

Filtering allows for:
- Sorting data to bring important information to the top.
- Using advanced filter criteria for complex data subsets.
- Extracting unique records or removing duplicates.
Optimizing for Performance

Excel can handle millions of cells, but here’s how to keep it responsive:
- Avoid Volatility: Minimize the use of volatile functions (RAND, NOW, INDIRECT).
- Limit External Links: External references can slow down your workbook; consider updating manually.
- Use Excel’s Data Model: For handling large datasets without performance hits.
- Disable Automatic Calculation: Switch to manual calculation mode for large datasets, then recalculate when necessary.
Data Presentation and Reporting

1. Dashboarding

Create interactive dashboards using:
- Slicers for PivotTables to allow dynamic filtering.
- Charts, tables, and sparklines for visual data representation.
- Tabs or hyperlinks to different sections or views.
2. Conditional Formatting

Use conditional formatting for:
- Highlighting key metrics or trends.
- Visualizing data distribution with color scales.
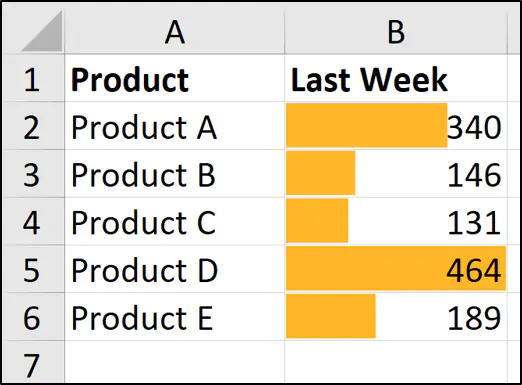
- Creating data bars or icon sets to compare values.
Keeping Your Master Sheet Organized

Over time, your master sheet can become cluttered. Here are some tips to keep it clean:
- Regularly review and remove unnecessary columns or data.
- Use clear headers and color-coding to denote different data sets or time periods.
- Implement a change log or version control to track modifications.
Wrapping Up

Mastering Excel’s master sheet analysis is not just about knowing the tool but about structuring your data to maximize efficiency, minimize errors, and facilitate data-driven decision-making. The key points covered here include understanding why to use a master sheet, setting it up correctly, validating data, utilizing Excel’s analytical tools, optimizing performance, and presenting your findings effectively. By adhering to these tips and tricks, you’ll transform raw data into actionable insights, streamlining your workflow and enhancing your ability to analyze and report data accurately.
What is the benefit of using a single master sheet in Excel?

+
A master sheet consolidates all data, reducing errors from data duplication, speeds up data retrieval for reporting, and provides a single source of truth for collaboration and decision-making.
Can I use PivotTables without a master sheet?

+
While you can use PivotTables with individual datasets, a master sheet enhances their functionality by providing comprehensive data for analysis, enabling dynamic summarization, and streamlining the updating process.
How often should I update my master sheet?

+
Updating frequency depends on your data source and analytical needs. For real-time analysis, daily or hourly updates might be necessary, while for monthly reports, a weekly or monthly update could suffice.