Analyzing Excel Data Across Sheets: A Simple Guide

Why Analyze Data Across Excel Sheets?

Excel is a powerhouse for data analysis, offering tools that can handle a wide array of calculations and data manipulations. However, when dealing with large datasets that span multiple sheets, organizing and analyzing this information can become daunting. Excel provides methods to effortlessly combine, compare, and analyze data from different sheets, making it indispensable for businesses, researchers, and students alike.
Preparing Your Excel Workbook

Before diving into the analysis, ensure that:
- Your workbook contains all relevant sheets that you need to analyze.
- The structure of the data in each sheet is uniform (e.g., same column headers).
- Check for and correct any data entry errors.
- Name your sheets sensibly for easier reference.
Consolidating Data with 3D References

Excel's 3D references allow you to calculate across multiple sheets effortlessly. Here's how:
Step 1: Select Your Range

Click on the first sheet, hold down Shift, and click the last sheet in your workbook.
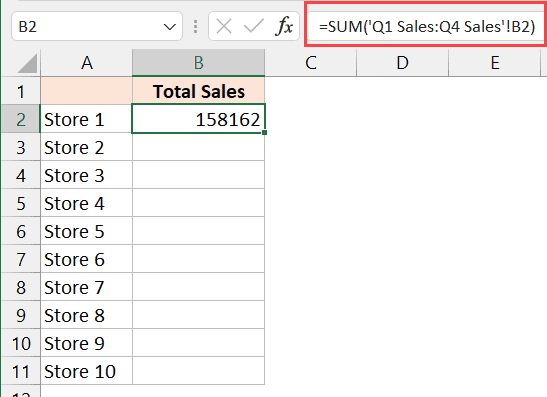
Step 2: Use a 3D Reference

To sum a range like sales data across sheets:
=SUM(Sheet1:Sheet3!B2)
📌 Note: Ensure the cell reference is consistent across all sheets to avoid errors.
VLOOKUP Across Multiple Sheets

VLOOKUP is crucial for retrieving data based on a key across different sheets. Here's how you can use it:
Step 1: Choose Your Sheet and Column

If you need to look up a name in “Sheet1” to find a corresponding value in “Sheet2”:
=VLOOKUP(A2,Sheet2!A2:B100,2,FALSE)
📌 Note: Always reference the range where the lookup value might exist. Sorting the data can improve VLOOKUP efficiency.
Index Match Across Sheets

INDEX MATCH offers more flexibility than VLOOKUP. Here's the setup:
Step 1: Define Your Lookup Value and Array

Let’s say you want to find a product’s price in “Sheet2” using its ID from “Sheet1”:
=INDEX(Sheet2!B:B,MATCH(Sheet1!A2,Sheet2!A:A,0))
📌 Note: This formula is robust for horizontal and vertical lookups, unlike VLOOKUP which is vertical-only.
Creating Dynamic Summaries

Use Excel's power query or pivot tables for dynamic data analysis across sheets:
Power Query for Data Integration

- Go to Data > Get Data > From Workbook to combine sheets.
- Select and combine the data, then transform it as needed.
Pivot Table for Quick Summarization

- Create a pivot table by selecting data from one sheet and then include data from other sheets in the ‘Get External Data’ feature.
- You can now slice, dice, and drill down into your data from multiple sheets.
Mastering Excel Shortcuts

To streamline your work across multiple sheets:
Excel Navigation Shortcuts

- Ctrl+Page Up/Down to move through sheets.
- Alt+Tab for cycling between workbooks.
- Ctrl+Shift+L to toggle filters on and off.
Formula Shortcuts

- Ctrl+Shift+Enter for array formulas.
- Ctrl+; for entering the current date.
- Alt+= to auto-sum cells.
By mastering these shortcuts, you can work more efficiently, saving both time and reducing the chances of errors.
Summary and Best Practices

In this guide, we’ve explored several ways to analyze data across Excel sheets, from simple 3D references to more advanced techniques like power query and pivot tables. Here are some key takeaways:
- Ensure your data is clean and well-organized before analysis.
- Use VLOOKUP, INDEX MATCH, and 3D references for efficient data retrieval and calculations.
- Leverage Excel’s built-in tools like Power Query for combining data and pivot tables for summarizing it.
- Utilize keyboard shortcuts to speed up your workflow and reduce repetitive tasks.
- Regularly save your work, and consider working in smaller workbooks to manage data volume better.
How can I improve my Excel skills for data analysis?

+
Regular practice, taking online courses, and using Excel’s help resources can significantly enhance your data analysis skills. Books like “Excel Data Analysis for Dummies” can also offer structured learning.
What’s the difference between VLOOKUP and INDEX MATCH?

+
VLOOKUP is simpler for vertical lookups but less flexible. INDEX MATCH can perform vertical or horizontal lookups, offers dynamic ranges, and doesn’t break if you add columns.
Are there any risks when working with data from multiple sheets?
+
Yes, potential issues include reference errors if sheets are renamed or rearranged, data inconsistencies, and increased risk of overwriting or losing data. Always cross-verify and backup your work.
How do I handle large datasets in Excel?
+
For large datasets, consider using Power Query for data cleaning and consolidation, or external tools like SQL databases linked to Excel. Also, work in smaller, manageable workbooks, and use Excel’s new dynamic arrays for more efficient calculations.