Adding Excel Sheets in Tableau Online: Simplified Guide

Understanding Excel and Tableau Synergy

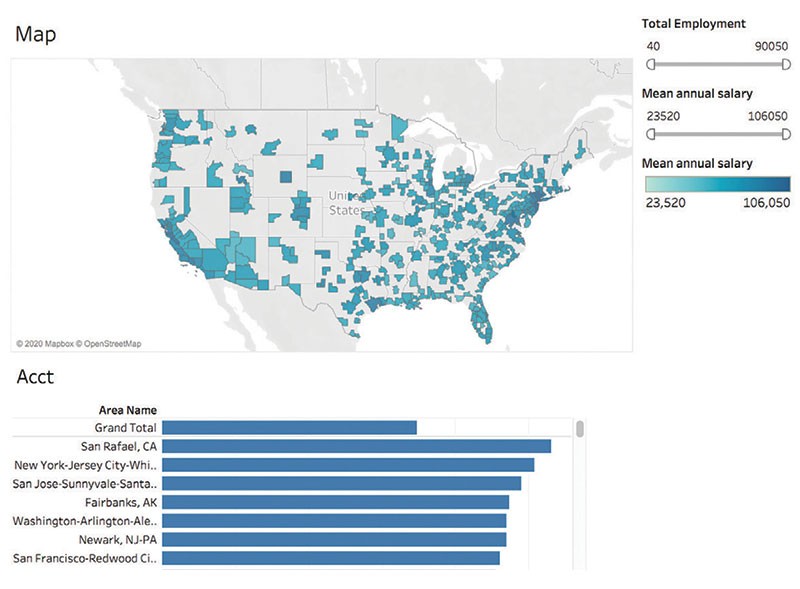
Excel and Tableau, when combined, create a powerful platform for data visualization and analysis. Excel is an essential tool for data manipulation and storage, known for its robust capabilities in spreadsheet management. However, when it comes to dynamic data visualization, it has limitations. Here’s where Tableau Online steps in, offering capabilities that help in creating interactive, shareable dashboards directly from your Excel data. The synergy of these tools allows for:
- Streamlined data importation from Excel into Tableau.
- Real-time data synchronization for up-to-date visualizations.
- Enhanced data analysis and presentation features through Tableau’s interactive dashboards.
Importing Excel Data into Tableau Online

When you start with importing your Excel data into Tableau, follow these steps:
Prepare Your Excel Data: Ensure your Excel workbook is clean and well-formatted. Each column should have a clear heading, and data should be consistently formatted.
Connecting to Excel in Tableau: Open Tableau Online, then:
- Click on “Connect” in the left-hand pane.
- Choose “To a File” and select Excel.
- Navigate to your Excel file and open it.
Tableau Connection Dialog: You’ll see a dialog where you can:
- Drag and Drop: Drag your data tables or queries into the Data Pane.
- Connect Live or Extract: Choose whether you want to connect live to the Excel data or extract it for local analysis.
🔍 Note: Connecting live provides real-time data updates but requires constant access to the Excel file. Data extracts allow for a fixed dataset, ideal for one-time analyses or when real-time isn’t necessary.
- Data Extraction: If you extract, Tableau allows you to filter the data you’re importing, removing unnecessary rows or columns to streamline your dashboard.
Setting Up Your Data Source

After importing your data:
Rename and Organize: Give meaningful names to your tables or sheets, making it easier to navigate your dashboard design.
Creating Relationships: Establish relationships between different sheets or tables to unify your data for seamless analysis.
<table>
  <thead>
    <tr>
      <th>Sheet Name</th>
      <th>Relationship Key</th>
    </tr>
  </thead>
  <tbody>
    <tr>
      <td>Sales</td>
      <td>Customer ID</td>
    </tr>
    <tr>
      <td>Customers</td>
      <td>Customer ID</td>
    </tr>
  </tbody>
</table>
- Data Preparation in Tableau Prep: For complex datasets, consider using Tableau Prep to clean and transform your data before loading it into Tableau Online.
Creating Visualizations and Dashboards

With your data in place:
Drag-and-Drop Analysis: Use Tableau’s drag-and-drop interface to select measures and dimensions, creating various visualizations like bar charts, line graphs, or pie charts.
Adding Filters and Parameters: Enhance user interaction by adding filters, parameters, or action-based navigation.
Designing Your Dashboard: Place your visualizations onto the dashboard canvas, ensuring:
- Logical flow for user interaction.
- Consistent design elements for readability.
- Clarity in data representation.
🔑 Note: Good dashboard design minimizes the cognitive load, helping users to make sense of the data without unnecessary effort.
Data Updates and Maintenance

Maintaining your dashboard includes:
Real-Time Updates: If you’ve set up a live connection, Tableau will automatically refresh data from Excel. For extracts, schedule refresh times based on your data update frequency.
Handling Excel Updates:
- For live connections, ensure the Excel file remains accessible.
- With extracts, plan to manually update the data or set up automated extracts.
Data Governance: Use Tableau’s data governance tools to manage data access and ensure data integrity.
In summary, by leveraging the capabilities of both Excel and Tableau Online, you can enhance your data visualization process, from initial data preparation in Excel to interactive and shareable dashboards in Tableau. This synergy not only simplifies data analysis but also enables real-time insights, facilitating better decision-making across various industries.
By understanding these steps, preparing your Excel files, connecting to Tableau, setting up your data source, designing visualizations, and ensuring ongoing maintenance, you’ll unlock the potential of your data in a visually compelling manner.
🎉 Note: This synergy between Excel and Tableau Online truly unlocks a world of data visualization possibilities, making complex data easy to interpret and share with your team or stakeholders.
Can I edit Excel data directly from Tableau Online?

+
No, you cannot edit Excel data directly from Tableau Online. However, you can edit your Excel file and then refresh or re-extract the data in Tableau.
How often should I refresh the data in Tableau Online?

+
The frequency of data refresh depends on your needs. For real-time data, set up live connections, whereas for periodic updates, schedule extracts to run daily, weekly, or monthly.
What should I do if my Excel file changes its structure?

+
If the structure of your Excel file changes (e.g., new columns, renamed fields), you’ll need to reconnect and possibly reconfigure your data source in Tableau to reflect these changes.
Can Tableau Online handle multiple Excel sheets within one workbook?

+
Yes, Tableau Online can handle multiple sheets within one workbook. You can establish relationships between sheets to create a comprehensive data model for analysis.
Is there any limit to the size of Excel data I can import into Tableau Online?

+
Tableau Online has a 1GB data size limit per site. For larger datasets, consider using Tableau Server or extract your data to reduce the file size.