5 Simple Tips to Create Excel Multisheet Summaries

If you're looking to enhance your Excel skills and streamline your data analysis tasks, understanding how to create multisheet summaries in Excel can be incredibly beneficial. Whether you are handling business reports, financial analyses, or any large datasets, knowing how to summarize information across multiple sheets can save you time and improve your efficiency. This post will guide you through five straightforward yet effective tips to create dynamic and informative multisheet summaries in Excel.
Tip 1: Use Named Ranges


Named ranges in Excel are a powerful feature for referring to cell ranges consistently across your workbook. Here’s how you can make the most of them:
- Define a Named Range: Select a range of cells, go to the Name Box above the formula bar, type a name for your range, and press Enter.
- Use in Formulas: Instead of typing cell references, use the named range for clarity and ease of use. For example, =SUM(DataRange) instead of =SUM(A1:A50).
📌 Note: Named ranges must be unique within a workbook, and they make your formulas easier to read and manage.
Tip 2: Leverage 3D References

3D references in Excel allow you to create formulas that span across multiple sheets, making your summaries more dynamic and powerful:
- Reference Data: Use the syntax like ‘Sheet1:Sheet3’!A1 to reference cell A1 from Sheet1 to Sheet3.
- Summarize Data: To sum data across sheets, you could use =SUM(Sheet1:Sheet3!A1). This simplifies aggregating data from multiple sheets.
Tip 3: Create a Dynamic Dashboard


A dashboard can give a quick overview of your multisheet data. Here’s how to build one:
- Set Up the Dashboard Sheet: Add a new sheet for your dashboard.
- Insert Data Links: Use =‘SheetName’!CellAddress to link data from other sheets to your dashboard.
- Add Charts: Create charts that dynamically update as your source data changes.
Visual aids like charts not only make the data more digestible but also enhance the overall appeal of your summary.
Tip 4: Implement Excel Tables

| Sheet Name | Data Range |
|---|---|
| Sheet1 | Table1 |
| Sheet2 | Table2 |

Excel tables are not just visually pleasing; they also offer dynamic ranges:
- Convert Data into Tables: Select your data and go to Insert > Table.
- Reference Tables: In your summary formulas, reference tables with the [@[ColumnHeader]] syntax to pull data automatically.
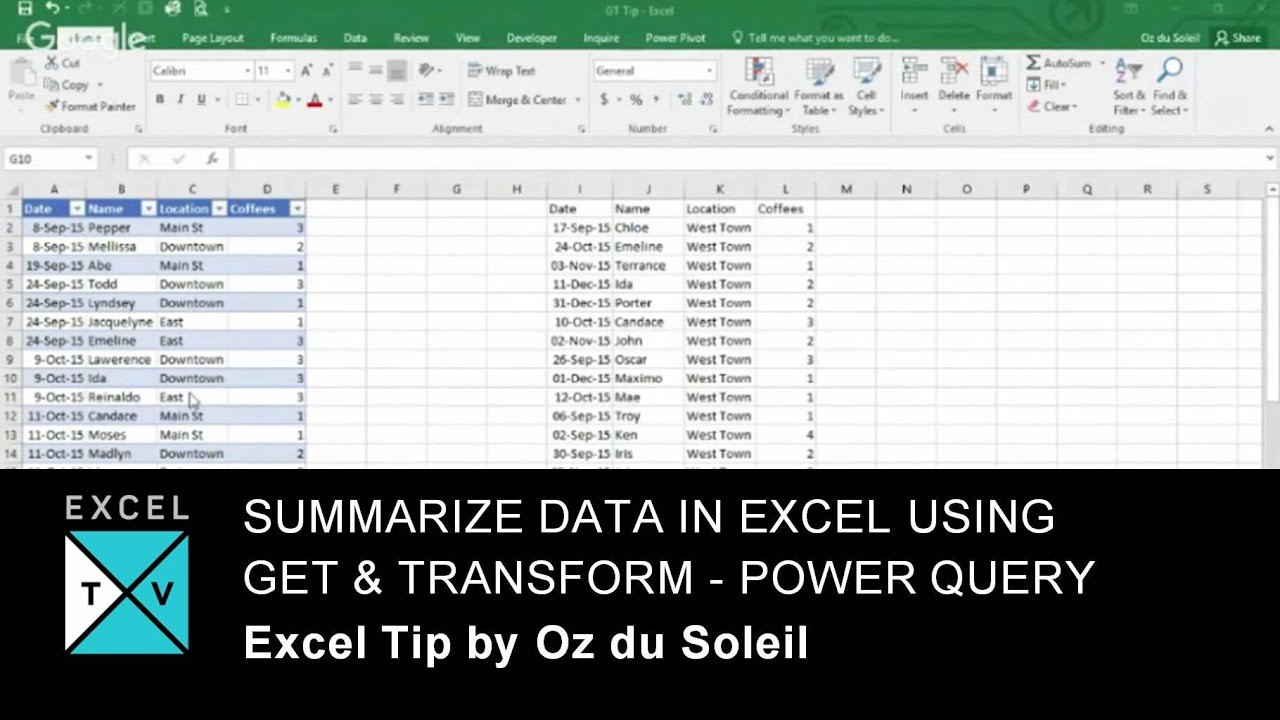
Tip 5: Use Power Query for Data Consolidation

For more complex datasets, Power Query is invaluable:
- Import Data: Use Power Query to import data from various sheets or external sources into one location.
- Transform and Clean: Use Power Query’s transformation tools to clean and standardize data before creating summaries.
🔔 Note: Power Query is only available in Excel 2010 and later versions, ensuring your workbook is up-to-date.
By following these tips, you can turn your Excel workbook into a powerhouse of productivity. Excel multisheet summaries not only provide a clearer picture of your data but also enable you to quickly pull insights, present data professionally, and make informed decisions. Remember, these techniques are not just about making your work easier but also about presenting your findings in a way that's compelling and easy to understand.
What is a Named Range in Excel?

+
A Named Range in Excel is a feature that allows you to assign a unique name to a cell or a range of cells. This name can then be used in formulas, making them easier to read and manage.
How does 3D referencing work in Excel?

+
3D referencing in Excel allows you to refer to the same cell or range across multiple sheets. For example, =‘Sheet1:Sheet3’!A1 would reference cell A1 in Sheet1, Sheet2, and Sheet3.
What are the benefits of using tables in Excel?

+
Tables in Excel offer several benefits including structured references, dynamic data ranges, and ease of sorting and filtering. They also provide enhanced formatting options for better data visualization.
Can Power Query handle data from multiple sheets?

+
Yes, Power Query can consolidate data from multiple sheets within the same workbook or even from different workbooks, transforming and cleaning it for analysis.