Create and Use a New Chart Sheet in Excel

Introduction to Chart Sheets in Excel

Excel is a powerful tool for data analysis, and one of its strengths lies in its data visualization capabilities. Among the various ways to present data visually, Excel allows for the creation of chart sheets that serve as standalone sheets solely for displaying charts. This feature is particularly useful when you want to create a chart that you might share independently of the data or when you need to present the chart in a meeting or report without showing the underlying data.
Why Use Chart Sheets?

Before diving into the how-to, let’s explore why chart sheets are beneficial:
- Separation of Data and Visualization: Keeps the chart view cleaner by separating it from the raw data.
- Enhanced Focus: Presenters can focus on the chart itself, making it easier for audiences to grasp the information.
- Quick Navigation: Charts are easily found in the worksheet tab, improving navigation.
- Printing and Exporting: Charts can be printed or exported without the unnecessary data surrounding them.
How to Create a New Chart Sheet

Creating a new chart sheet is a straightforward process. Here are the steps:
- Select Your Data: Highlight the data you wish to visualize in your chart.
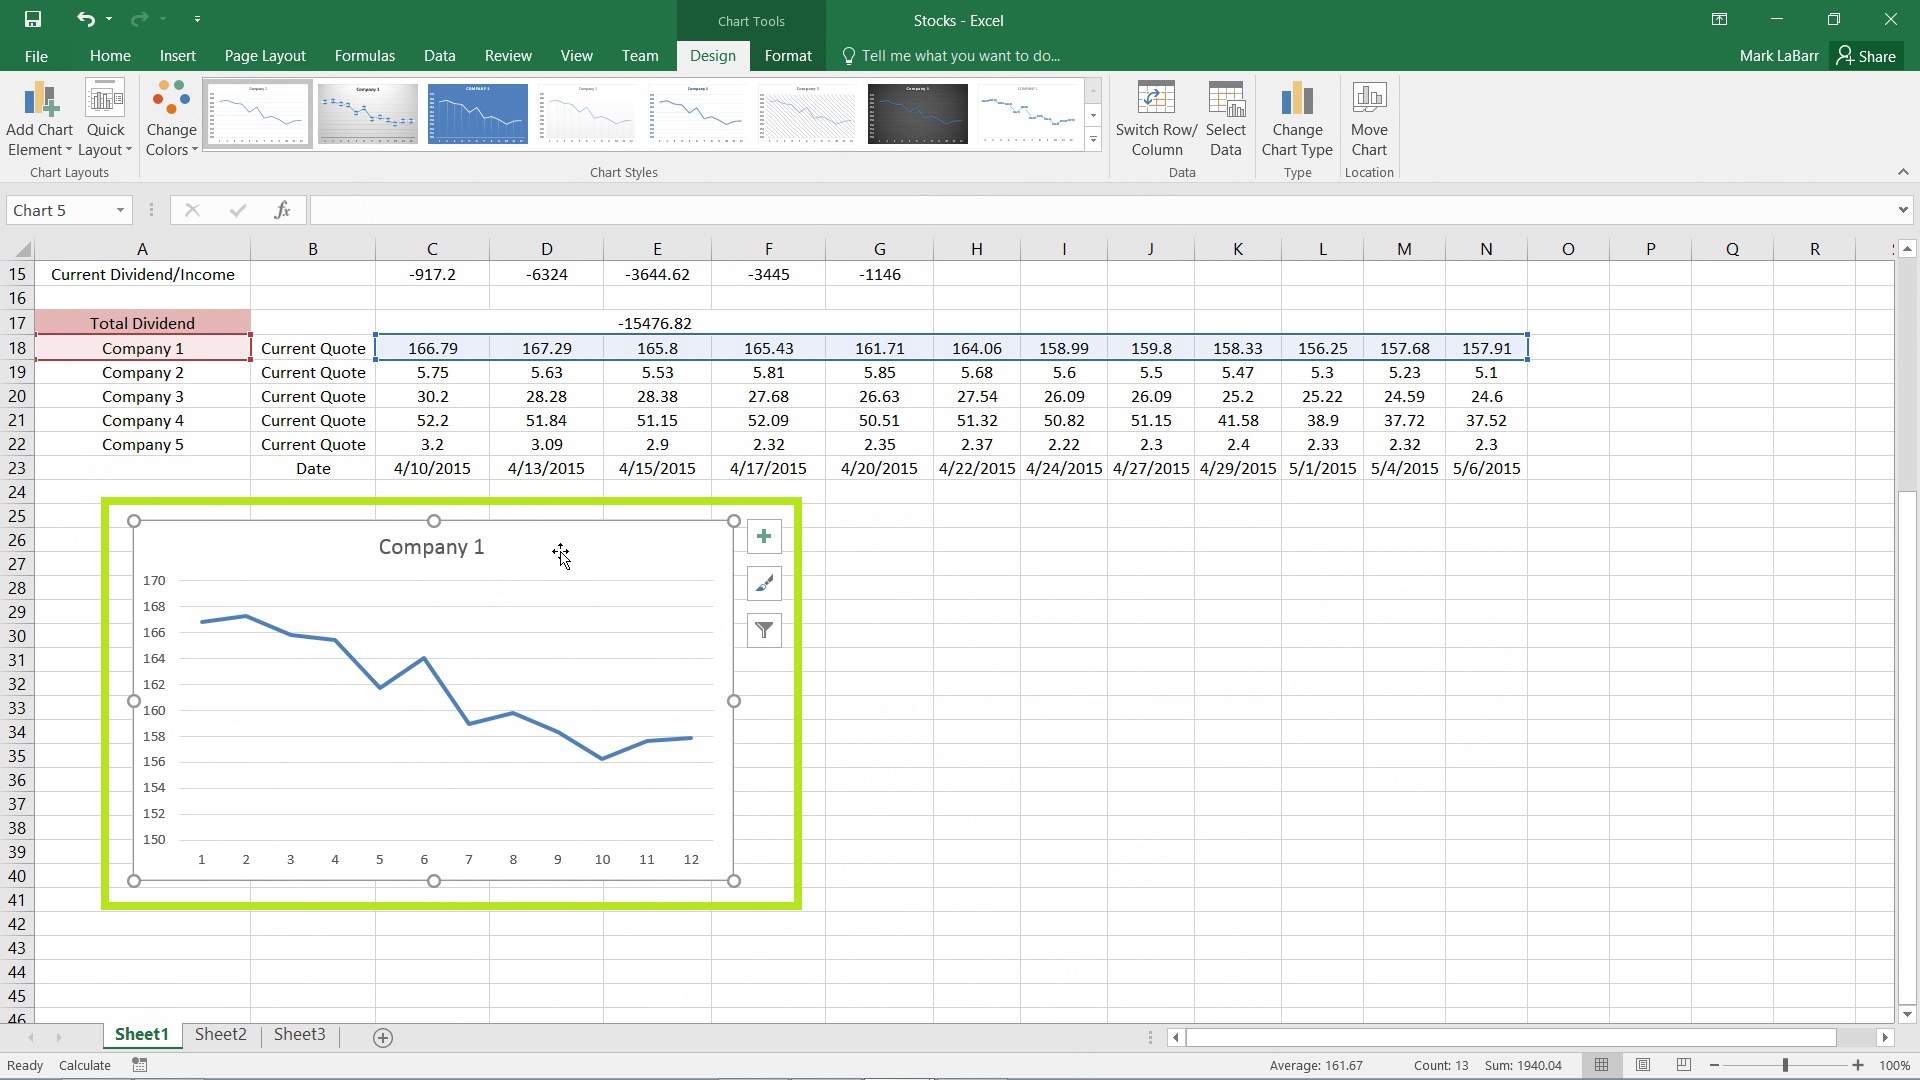
- Insert Chart: Navigate to the Insert tab on the ribbon and click on your desired chart type from the Charts group.
- Move Chart:
- Right-click on the chart and select Move Chart from the context menu.
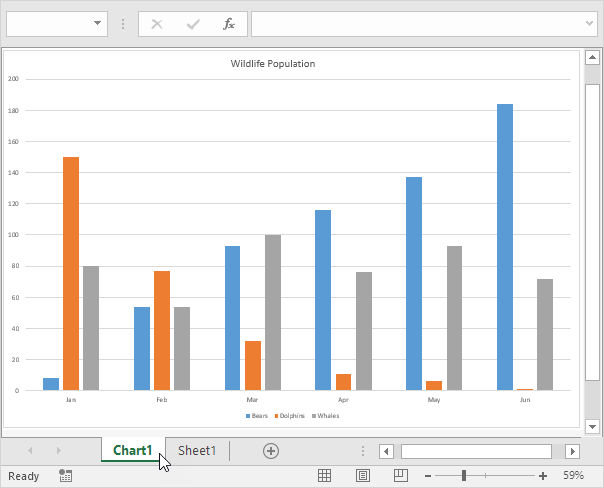
- In the Move Chart dialog box, choose New sheet.
- Name your new sheet or leave the default name.
- Click OK.
A new sheet tab with the chart will appear, and it can be renamed or formatted like any other worksheet.
Formatting and Customizing Your Chart Sheet

Once your chart is on its own sheet, you have several options for customization:
- Chart Layout and Styles: Use the Chart Tools that appear when the chart is selected to change the chart’s style, add chart elements like axis titles or a legend, or modify the layout.
- Chart Title: Double-click the chart title to edit it or add one if it’s missing.
- Background and Gridlines: You can add background colors, remove gridlines, or adjust them to better suit your presentation.
- Data Labels and Markers: Customize how data points are shown on your chart.
- Chart Types: Even after creation, you can switch to another chart type if your data visualization needs change.
Linking Data and Charts

To ensure your chart remains up-to-date:
- Use dynamic ranges or named ranges in your source data.
- Link your chart to external data sources.
- Ensure the chart’s data series is set to update automatically as data changes.
🔍 Note: Chart sheets do not contain data; they merely display the chart. If you need to edit the data, you will have to return to the original worksheet.
Summary

In Excel, chart sheets are an excellent way to present data visually with minimal clutter. They separate the chart from the source data, making it easier for viewers to focus on the chart’s message. By following the simple steps to create and customize a chart sheet, you can make your charts stand out in presentations, reports, or for personal use. Remember to link your data properly to keep the chart updated, and customize the visual elements to effectively communicate your findings.
Can I have multiple charts on one chart sheet?

+
No, Excel does not allow multiple charts to coexist on a single chart sheet. Each chart must have its own dedicated chart sheet.
How do I update the data on a chart sheet?

+
To update the data, navigate to the original worksheet where your data is stored, make changes, and the chart should reflect those changes if linked correctly.
Can I print a chart sheet without printing data?

+
Yes, simply select the chart sheet tab and print it as you would any worksheet. Only the chart will be printed.
What happens if the source data is deleted or moved?

+
If the source data is altered or removed, Excel will show an error on the chart, indicating that the data for the chart is missing or has changed.
Can I save a chart sheet as an image?

+
Yes, you can copy the chart and paste it as a picture in another program or right-click and save the chart as an image from Excel.